Energy Saving Support Software Energy Saving Support Software EcoAdviser

What is EcoAdviser?
Supporting activities across four cycles, from management to reduction of CO₂ emissions and energy use.
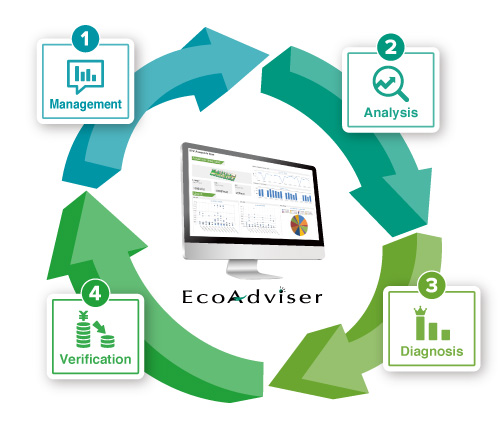
Management of CO₂ emissions and energy use
Centralized management of data on electricity, water, air, gas, heavy oil, and more!
(1) Management available even with limited function edition.
Analysis of causes of energy loss
Our proprietary AI technology can be used to automatically extract energy losses!
(2) Support provided by AI diagnosis edition after analysis.
Diagnosis of energy loss factors
Automatically determine energy loss factors and display rankings. Estimated effects of improvements can also be checked!
Verification of effectiveness of energy conservation measures
Simply select a period of time to check the effects of improvements before and after implementing energy conservation measures!
Line-up
Limited function edition (1)
Recommended for the following customers!
・Seeking to manage CO₂ emissions and energy use
AI diagnosis edition (1) to (4)
Recommended for the following customers!
・Seeking to automatically analyze energy waste
・Seeking to improve waste in production facilities
1. Management: Visualization of CO₂ emissions and energy use
- Limited function edition
- AI diagnosis edition
Keep track of energy using an extensive range of graphs. EcoAdviser makes it much more efficient to conduct energy conservation activities like creating reports and various daily tasks that had previously been completed using spreadsheet software. It also leverages visualization to assist with initiatives implemented at workplaces, and can help raise awareness by boosting understanding.

Understanding of current conditions
Want to visualize CO₂ emissions by area.
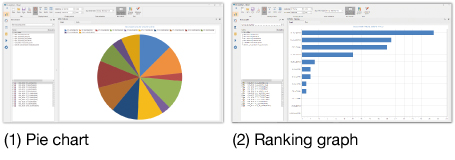
Pie chart and ranking graph visible at a glance

Specific unit control
Want control of not only energy, but also production quantity.
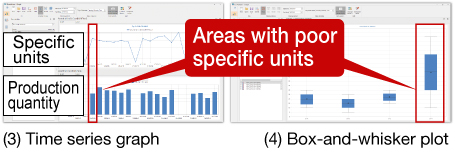
Poor productivity and variations visible at a glance

Creating a dashboard is an effective way to highlight information to company members!
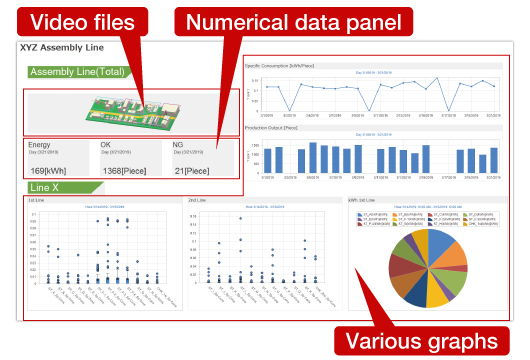
[ Examples of dashboard applications at customer sites ]
- ・Identify CO₂ emissions and energy use by each department and process
- ・Understand areas of improvement in energy conservation, etc.
Screen designs can be created at will for each customer!
2. Analysis: Automatic extraction of energy loss at production facilities
- AI diagnosis edition
An approach that focuses on five key areas of energy conservation perspectives by drawing on Mitsubishi Electric's know-how developed over many years, and automatically identifies energy loss from each of these perspectives.
What is Mitsubishi Electric's Know-how: Five key areas of energy conservation?
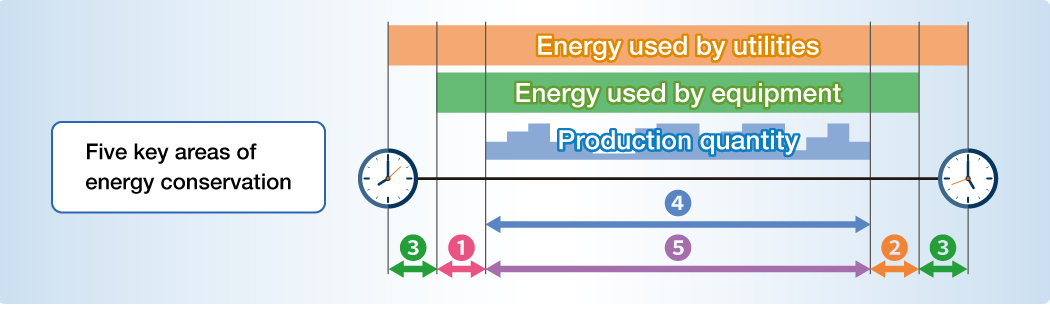
・Utilities start-up time loss ・・・・・・Utilities start-up to production equipment start-up time
・Utilities shutdown time loss ・・・・・Production equipment shutdown to utilities shutdown time
* Auxiliary equipment that operates in tandem with production equipment (e.g., ventilation fans, mist collectors, compressors, etc.)
Energy Loss Diagnostic Screen
3. Diagnosis: Diagnosis of energy loss factors
- AI diagnosis edition
Date, time, and production information is used to rank items correlating with factors causing energy loss, and presented together with the effects of expected improvements.
What is energy loss factor diagnosis?
This refers to items that are closely associated with days when energy losses are greater than normal.
Diagnosis results
Monday
Start-up 6 AM
250 units produced on the day

Conduct fact-finding based on diagnostic results, and implement specific measures
Measures based on results of diagnosis
Monday ➡ Revise the start-up/shutdown times of the associated equipment at the start of the week.
6 AM ➡ Remind employees not to start-up equipment unnecessarily early in the morning.
250 units➡ Revise the production plan, as losses are higher on days with low production quantity.
Energy Loss Factor Diagnosis Screen
4. Verification: Verification of effectiveness of energy conservation measures
- AI diagnosis edition
By simply selecting the period before and after the improvements were made, the amount of electricity usage, electricity consumption charges, and energy loss before and after the measures were implemented can be checked easily.