Events & Seminars / ShowroomProduct Monitoring Exhibition

The Future of Excellence Productivity with Real-Time Data Visualization
About The Future of Excellence Productivity with Real-Time Data Visualization
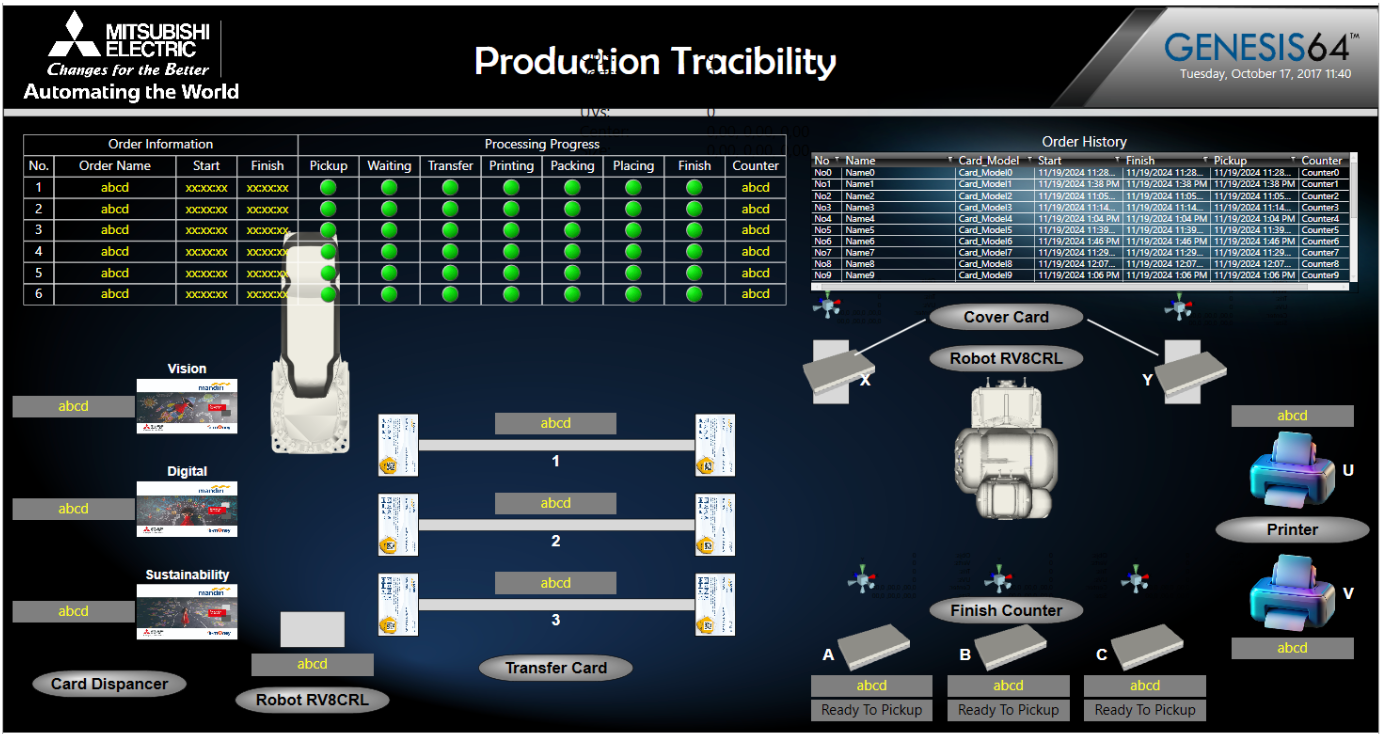
This is the Real-Time Data Visualization from each machine by Real-Time Data Collecting through Mitsubishi Electric’s Scada Software - Genesis64. Scada Software - Genesis64 presents Visualization Mobility Analytics and Real-time Connectivity to give the contextual appearance towards the company operationalization to the certain costumers in Automation Industry and also Smart Building. This level of technology offer a software solution that accessible to desktop or any Mobile Devices with centralized configuration and the ability to connect to any communication protocol under the Industrial standard.
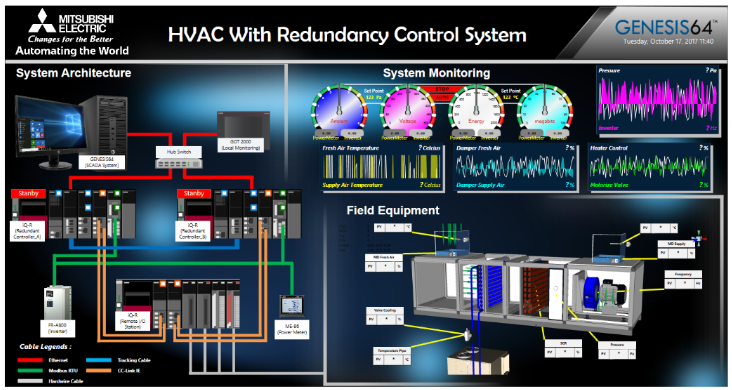
GENESIS64™ universal connectivity platform supports industry standard open protocol, accelerating integration of all kinds of devices, equipment, and systems, resulting in convergence of IT and OT.
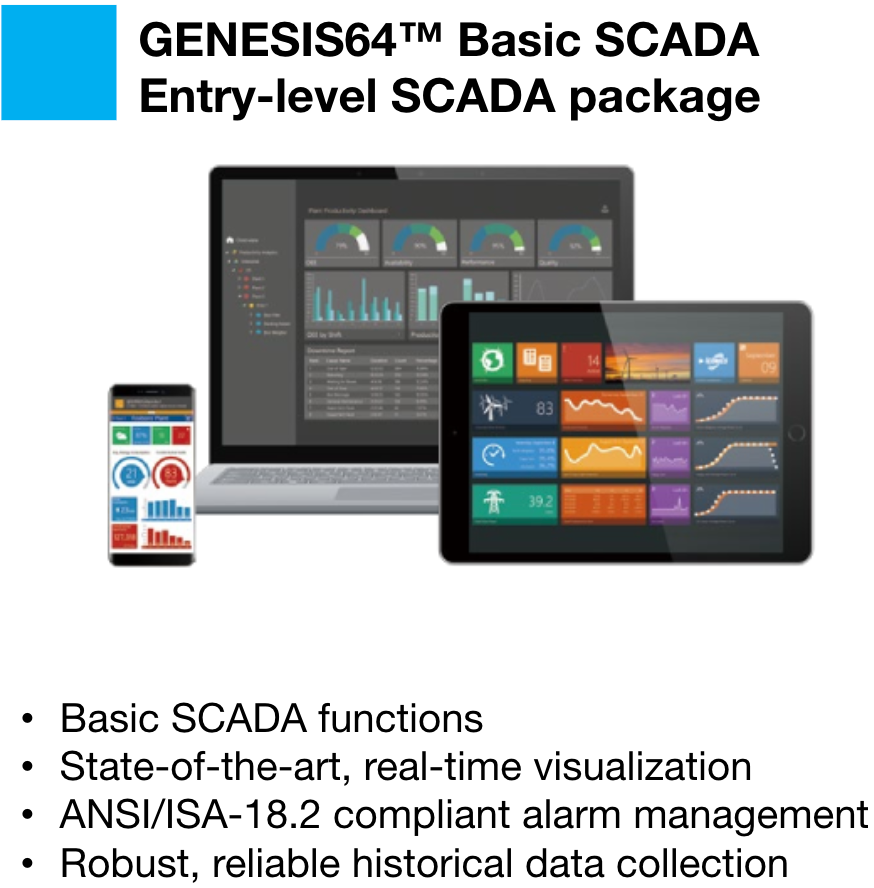
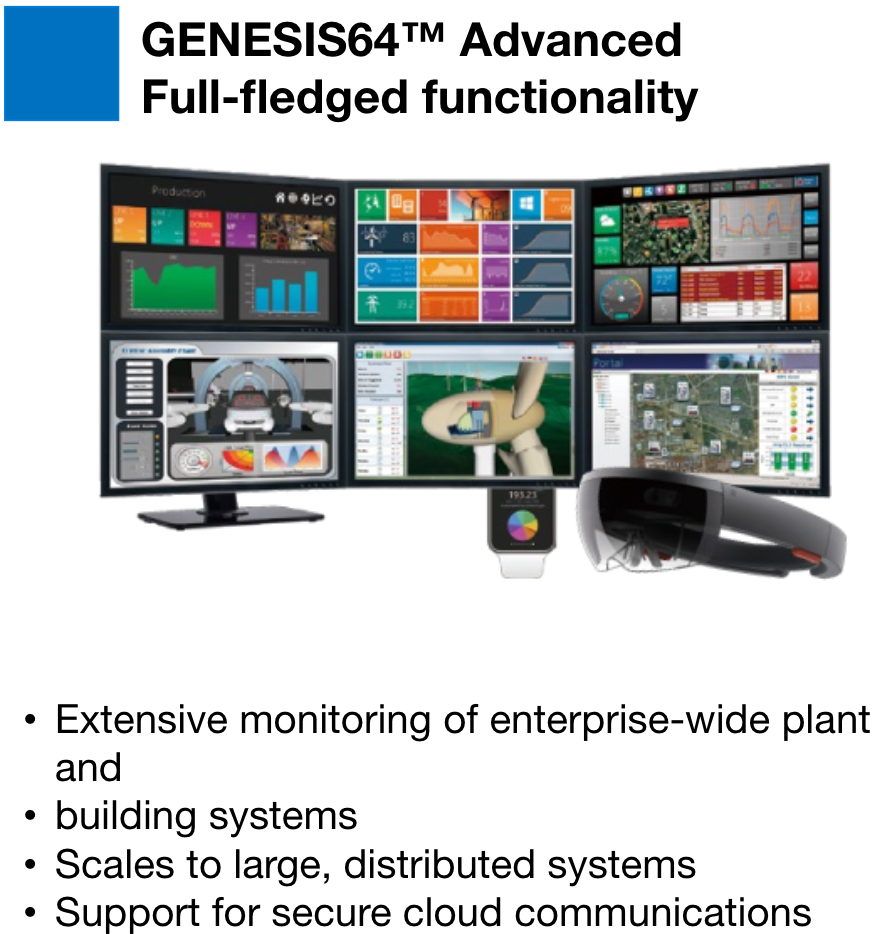
Secure, real-time visualization on any device is critical to keeping operations running smoothly. GENESIS64™ scales from desktops to browsers, tablets, smartphones, and wearable devices.
Asset-based organization and navigation facilitates data normalization, comparisons, and situational awareness to get to the root cause quicker through contextualized and actionable information.
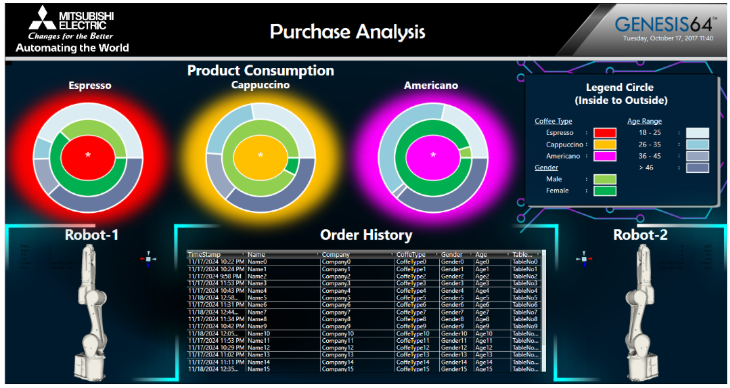
Improve operational productivity and quality with interactive analytics. Industry applications include OEE*2, SPC*3, energy, and fault detection to provide insight from edge to cloud.
Product Line up
Overview of Fukuyama Works Energy Saving
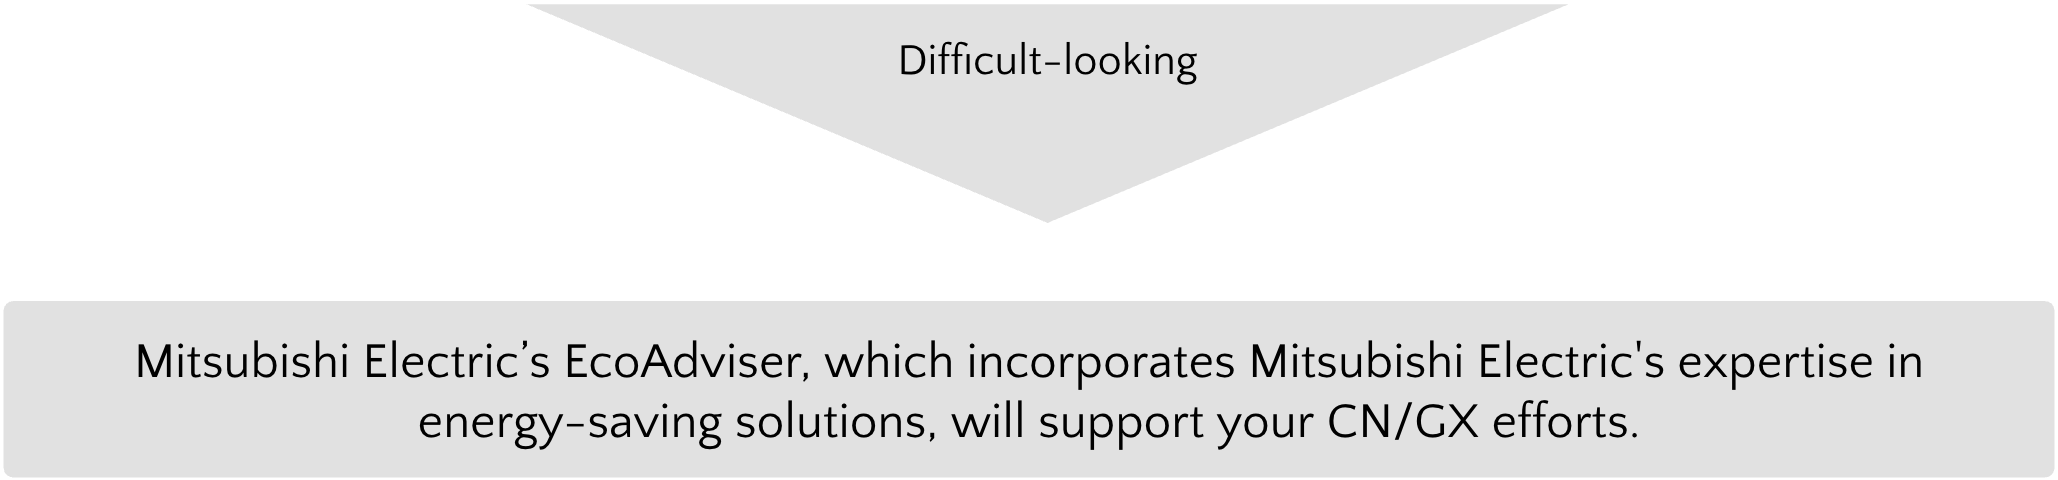
Recently, the promotion of CN (Carbon Neutral) and GX (Green Transformation) efforts are required for all corporate activities to achieve a decarbonized society. Each company has set high goals based on the schedule for achieving CN in each country, but since it is difficult to achieve these goals through activities in which only a few people take measures, it is necessary to work on them as a whole.To this end, each company is required to “cultivate awareness” of CN/GX and “identify issues” to promote CN/GX, and contribute to society through CN/GX initiatives.
Current Status and Analysis
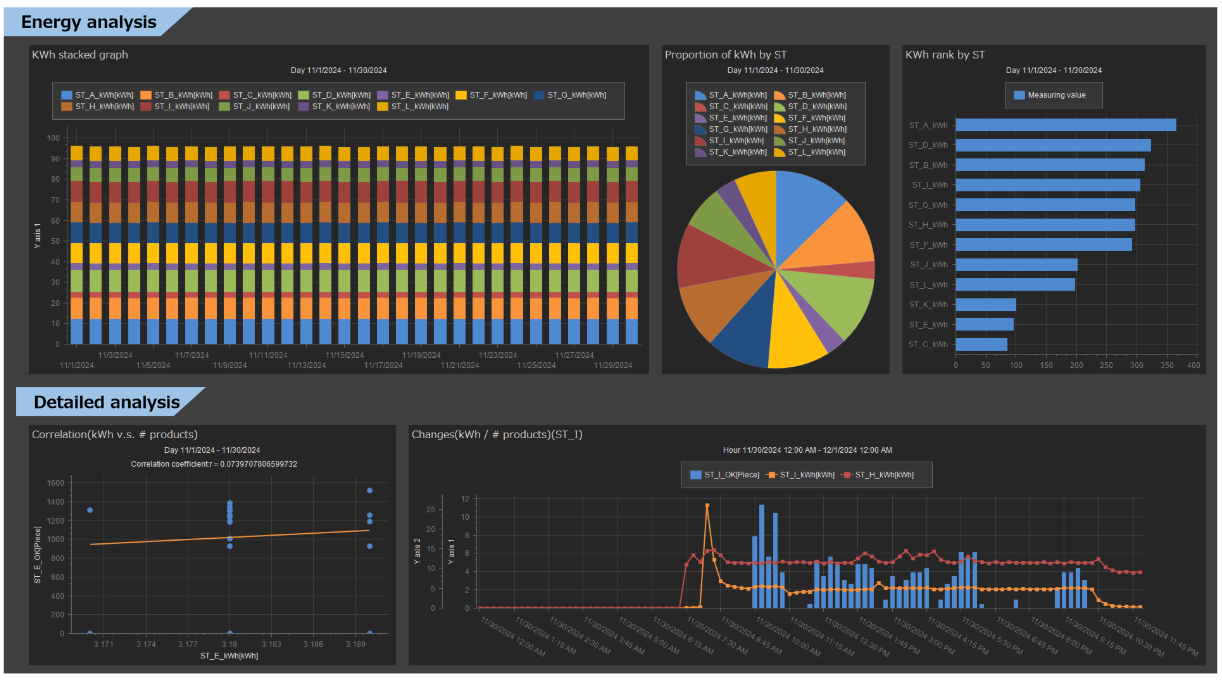
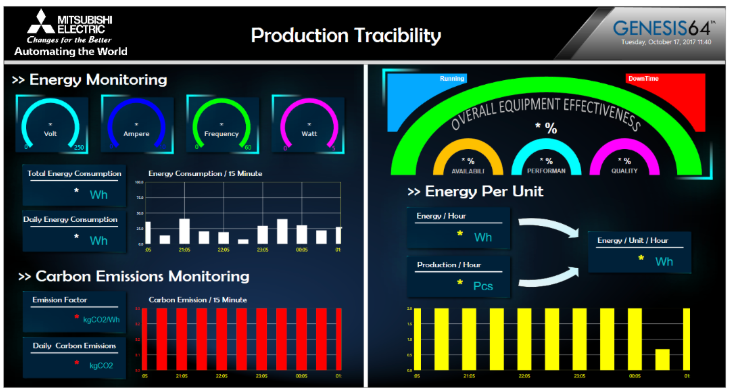
The screen allows the user to understand the current status of energy consumption and analyze energy loss on the factory production floor using a variety of graphs.
You can see energy consumption trends by production line, identify production lines with high energy consumption rates, and analyze energy losses using scatter plots and time-series graphs.
Energy loss diagnosis and effectiveness verification
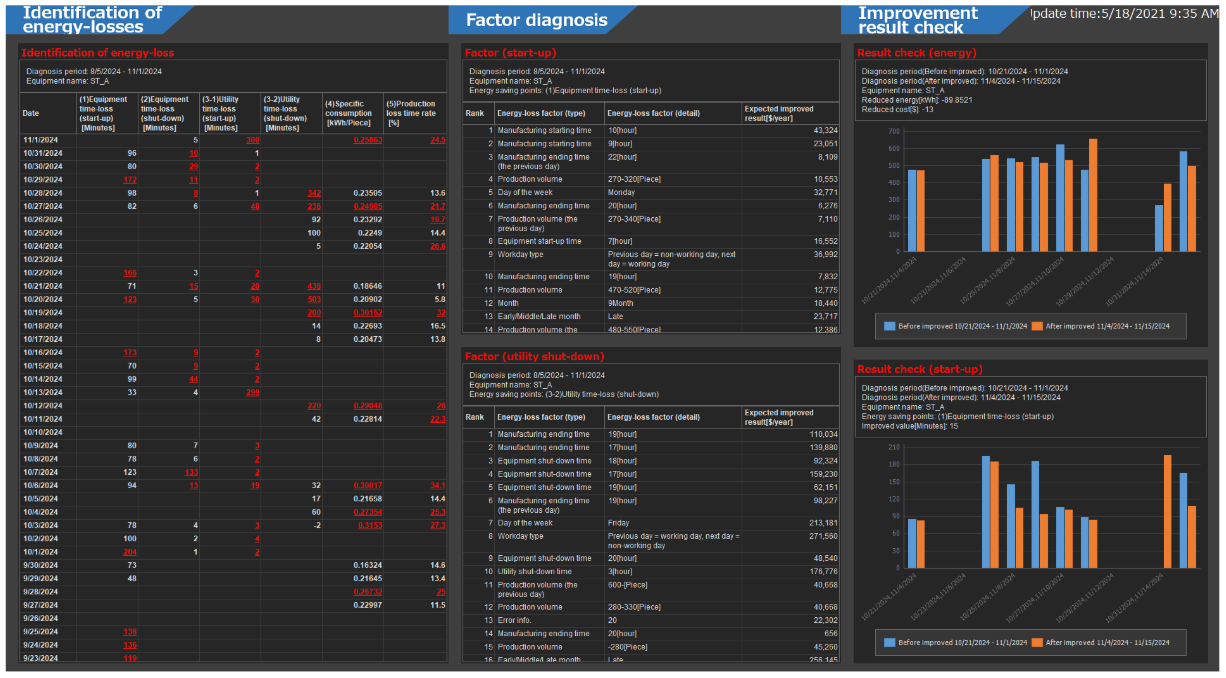
AI Diagnostics can automate the analysis of energy loss using the graph function.
The table on the left automatically calculates daily losses and shows deteriorating areas in red. Furthermore, the table in the middle can show the ranking of loss occurrence factors.
Based on these analysis and diagnosis results, energy-saving measures can be implemented, and the effects before and after the measures can be easily confirmed in the graph on the right.