Human-Machine Interfaces (HMIs)-GOT FA Application Package iQ Monozukuri

Easily analyze with a template for analyzation Analyzation
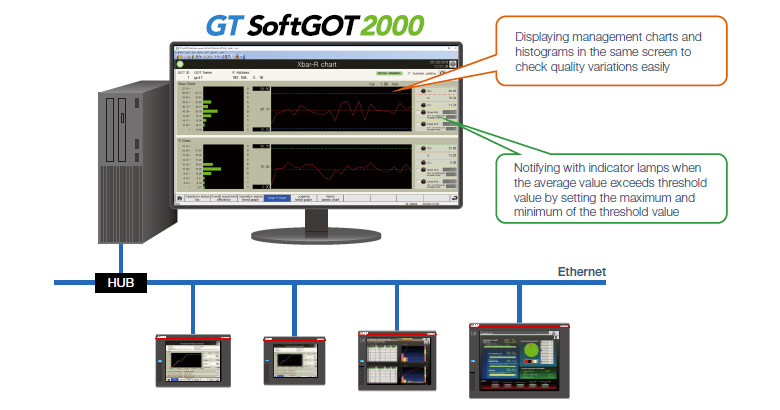
Analyzing product quality in the Xbar-R chart screen
The logging data collected and extracted with GOTs on each equipment can be displayed and checked in the Xbar-R chart screen and the process capability index (Cp and Cpk).
By displaying the Xbar-R chart and the histogram in the same screen, the variation of quality can be checked.
In addition, the notification can be displayed on the Xbar-R chart when the average value exceeds threshold value by setting the maximum and minimum of the threshold value.
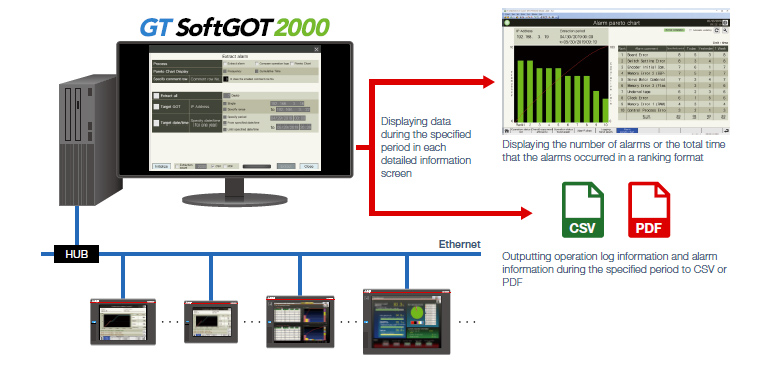
Analyzing factors by displaying alarms in a pareto chart
The alarm pareto chart can be displayed by using the alarm information collected from GOTs of each equipment. The number of alarms or the total time that the alarms occurred displayed in the chart can be used for analyzing the tendency of the alarms.
In addition, the condition to occur an alarm can be analyzed by extracting operation log information and alarm information during the same period (to a file) with simultaneous extract function for operation logs and alarms.
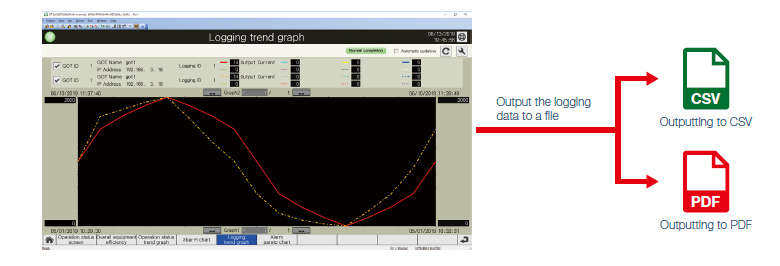
Comparison and analysis by overlapping two logging trend graphs
Two sets of logging data collected with different IDs can be selected and overlapped on a screen.
By overlapping the normal data and the data of the current state, the waveforms can be compared and analyzed.
The logging data can be output to a file.
- <Usage example 1>
- When selecting sets of logging data of different GOTs at the same time, the differences for each equipment can be compared.
- <Usage example 2>
- When selecting sets of logging data of electric current values that have the same ID, error detection and deterioration diagnosis can be performed by comparing the normal data and the data of the current (actual) state.
Improvement
Extract a problem from the analysis results.
Identify the root cause of the problem, and plan and implement countermeasures.