Human-Machine Interfaces (HMIs)-GOT FA Application Package iQ Monozukuri

Ready-to-install template screens for Process Remote Monitoring
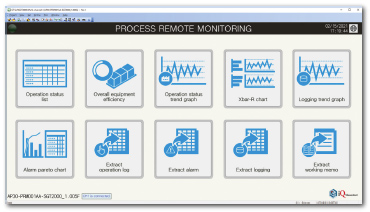
Main menu
The screen to switch to template screens of each function.
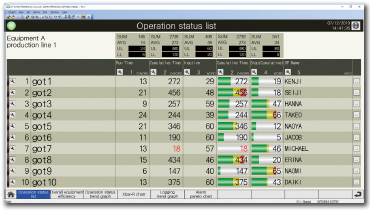
Operation status list
Displaying the operation statuses of selected on-site GOTs (devices) in a table format. Sum and average display and the upper and lower limit setting are available for each column.
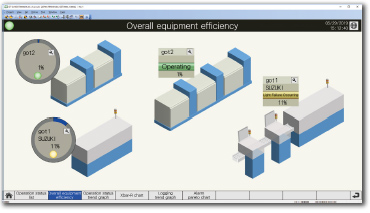
Overall equipment efficiency
Displaying the operation statuses of selected on-site GOTs (devices) with overall equipment effectiveness (OEE) on a schematic diagram of the production line.
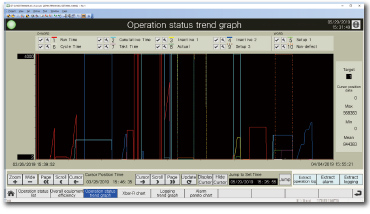
Operation status trend graph
Displaying the operation statuses of selected on-site GOTs (devices) in a graph format.
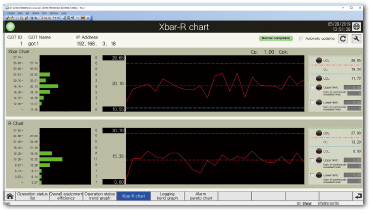
Xbar-R chart
Calculating the mean value (Xbar) and range (R) from the logging data collected as measurement values, and displaying them in an Xbar-R chart.
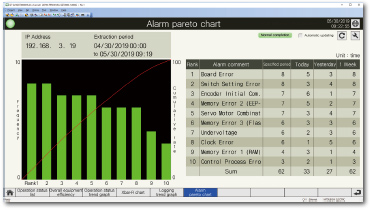
Alarm pareto chart
Aggregating alarms that occurred on multiple on-site GOTs and displaying them in a pareto chart and list.
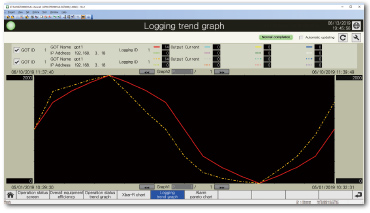
Logging trend graph
Select two different time axes and logging data of different on-site GOTs that have been collected and display them in the same graph.
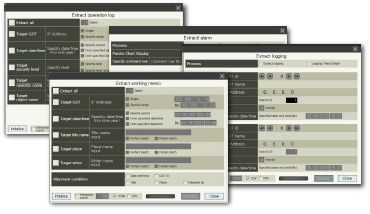
File output and screen display of resource data
Extracting the resource data under the set conditions and outputting the data to a file or displaying the data to a relevant template screen.
Target resource data types
- Operation log
- Alarm information
- Logging information
- Working memo NEW