SCADA MC Works64
 Promote energy saving
Visualize energy consumption and CO2 emissions in the whole system or per deviceEfficiently monitor wasted energy consumption
- Causes of abnormal energy use can be located by visualizing electricity and gas consumption in the factory, leading to cost reduction.
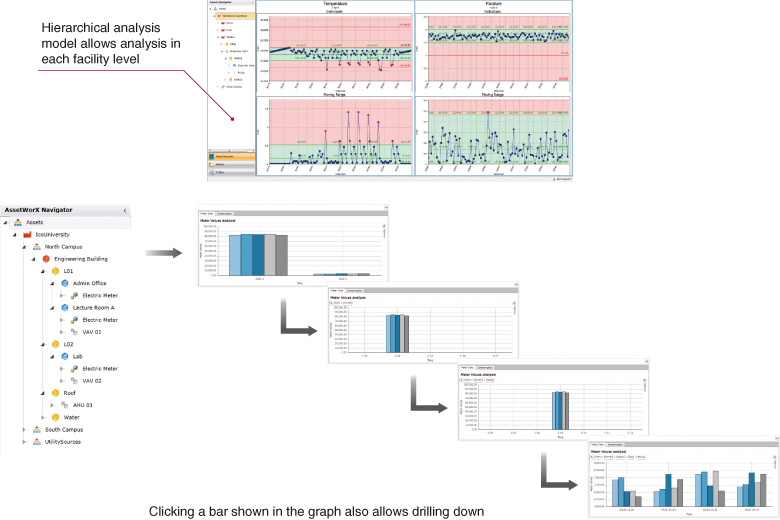
- Drilling down the left side tree on the screen (from the left tree in the lower image) displays the energy consumption in the graph according to the selected area/facility.