
How to use PLECS® Models
1. Location of the Model and Download Method
(1) Location of the Model
・Please visit the following URL to access the simulator's listing page.
< https://www.mitsubishielectric.com/semiconductors/powerdevices/design_support/simulator/ >
・After filling in the required information and agreeing to the disclaimer, you will be redirected to the
download page.
(2) Downloading the Model
・Following table 1 lists the zip files of PLECS models corresponding to the model names of power devices.
・When using the PLECS model, it is necessary to download the PLECS model and the calculation
environment corresponding to the model name of the power device being analyzed.
・In this case, we will use the IGBT module "CM450DY-24T" and perform loss calculations and temperature
rise calculations assuming a three-phase full-bridge inverter.
・Please download "CM450DY-24T.zip" and "Halfbridge_2level_inverter.zip" and temporarily store them in
an appropriate location, such as your desktop.
Table 1. Model Listings (Example)

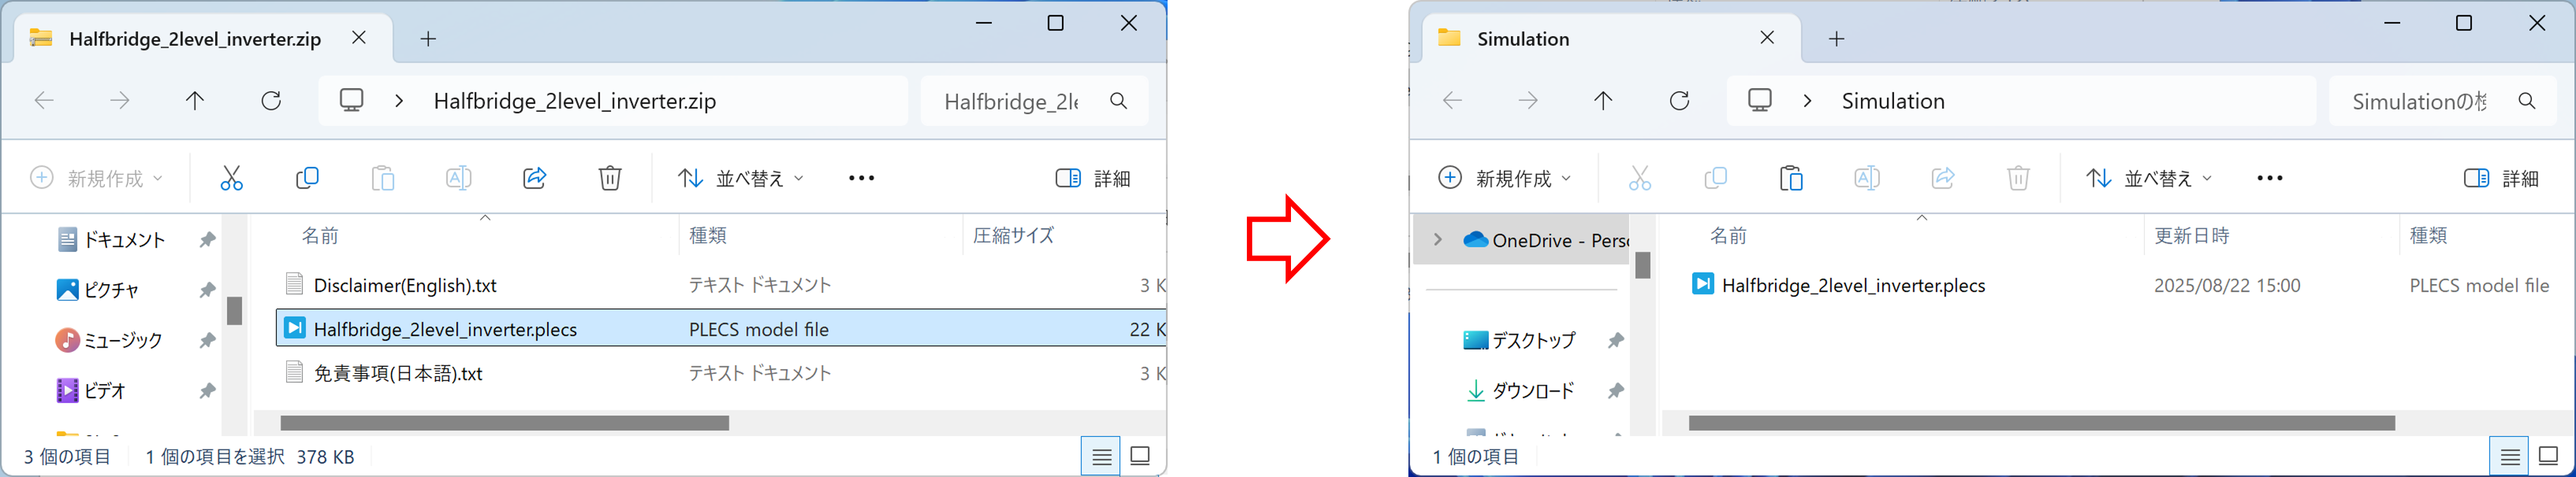
2. Storing the Model
(1) Storage Location for the Calculation Environment
・Create an appropriate folder and place "Halfbridge_2level_inverter.plecs" from "Halfbridge_2level_
inverter.zip" into it.
・This time, we will create a folder named "Simulation" on the desktop, as shown in Figure 1-1, and move
the file there.
Figure 1-1. Model Storage (Example)
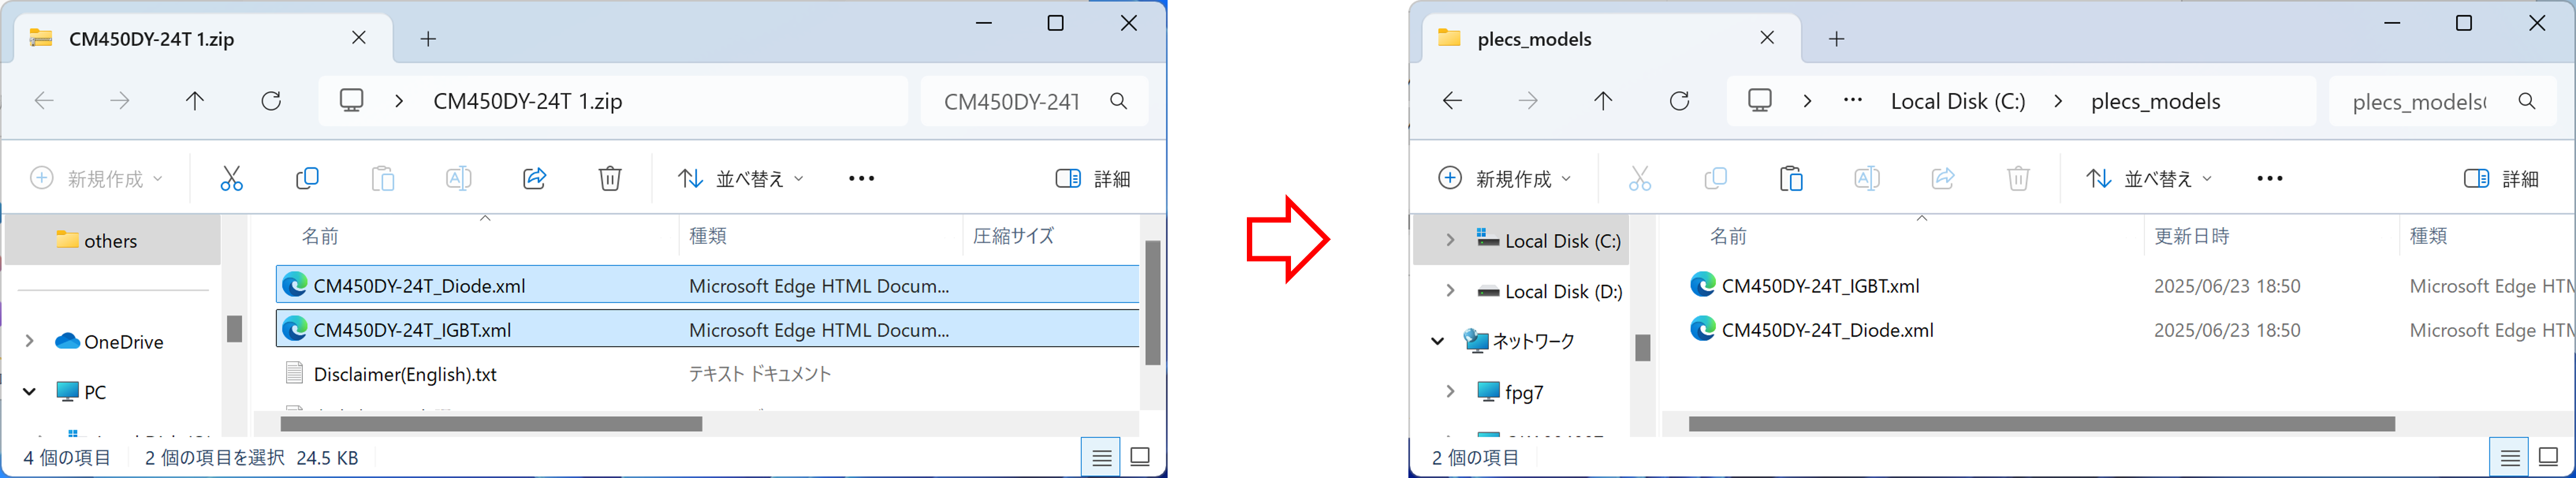
(2) Storage Location for the PLECS Model
・Create an appropriate folder and place "CM450DY-24T_IGBT.xml" and "CM450DY-24T_Diode.xml" from
"CM450DY-24T.zip" into it.
・This time, we will create a folder named "plecs_models" in "C:" as shown in Figure 1-2, and move the files
there.
Figure 1-2. Model Storage (Example)
3. PLECS Settings
・Double-click on "Halfbridge_2level_inverter.plecs" in the "Simulation" folder to open it.
・As shown in Figure 2 below, go to the "File" tab → "PLECS Settings" → "Thermal Settings" in that order,
click on "+", select the folder where the PLECS model is stored, "C:\plecs_models", and then click "OK".
(note)
This time, the interface is described in Japanese, but you can configure the settings by following the order
indicated by the arrows around the area enclosed in red. If the item names or order change due to a version
update, please follow those changes.
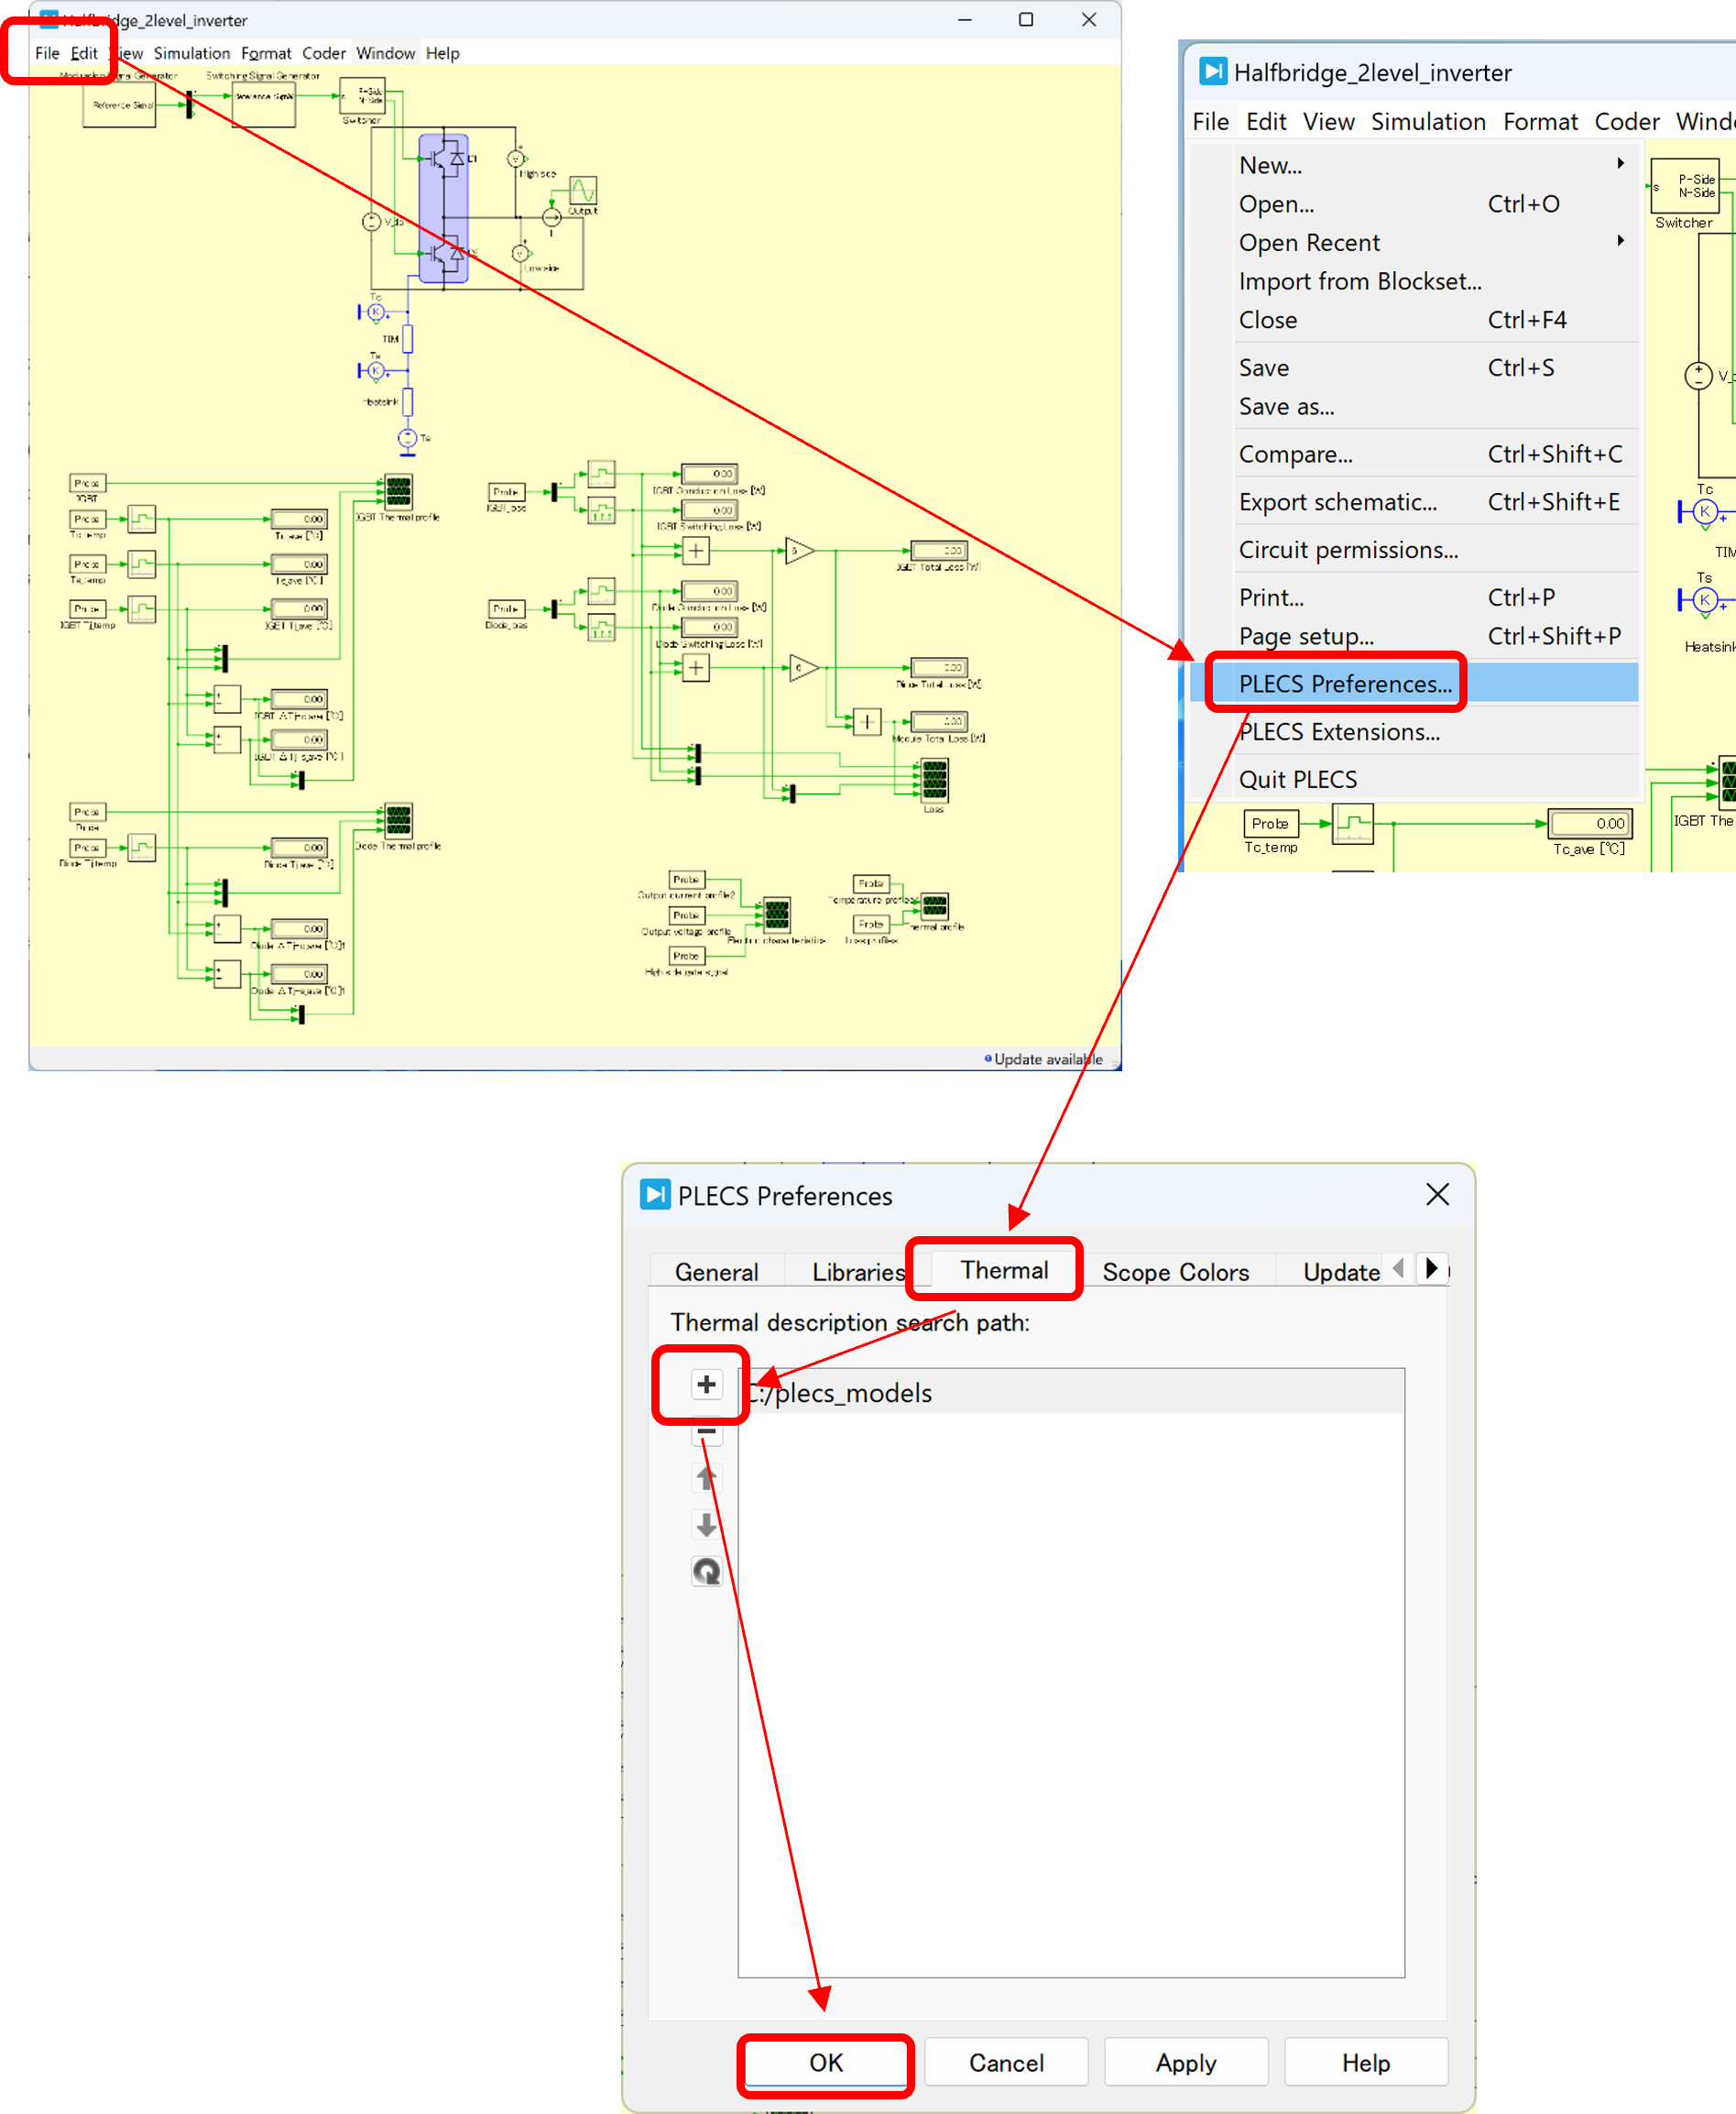
Figure 2. PLECS Settings (Example)
4. Selection of Components
(1) Selection of IGBT Components
・To select the IGBT "CM450DY-24T_IGBT" for the half-bridge calculation, double-click on the IGBT symbol
and select the target model name in the "Thermal Settings" under "Block Parameters."
Please refer to Figure 3-1.
・Additionally, for the half-bridge, select both the upper and lower IGBTs in the same manner.
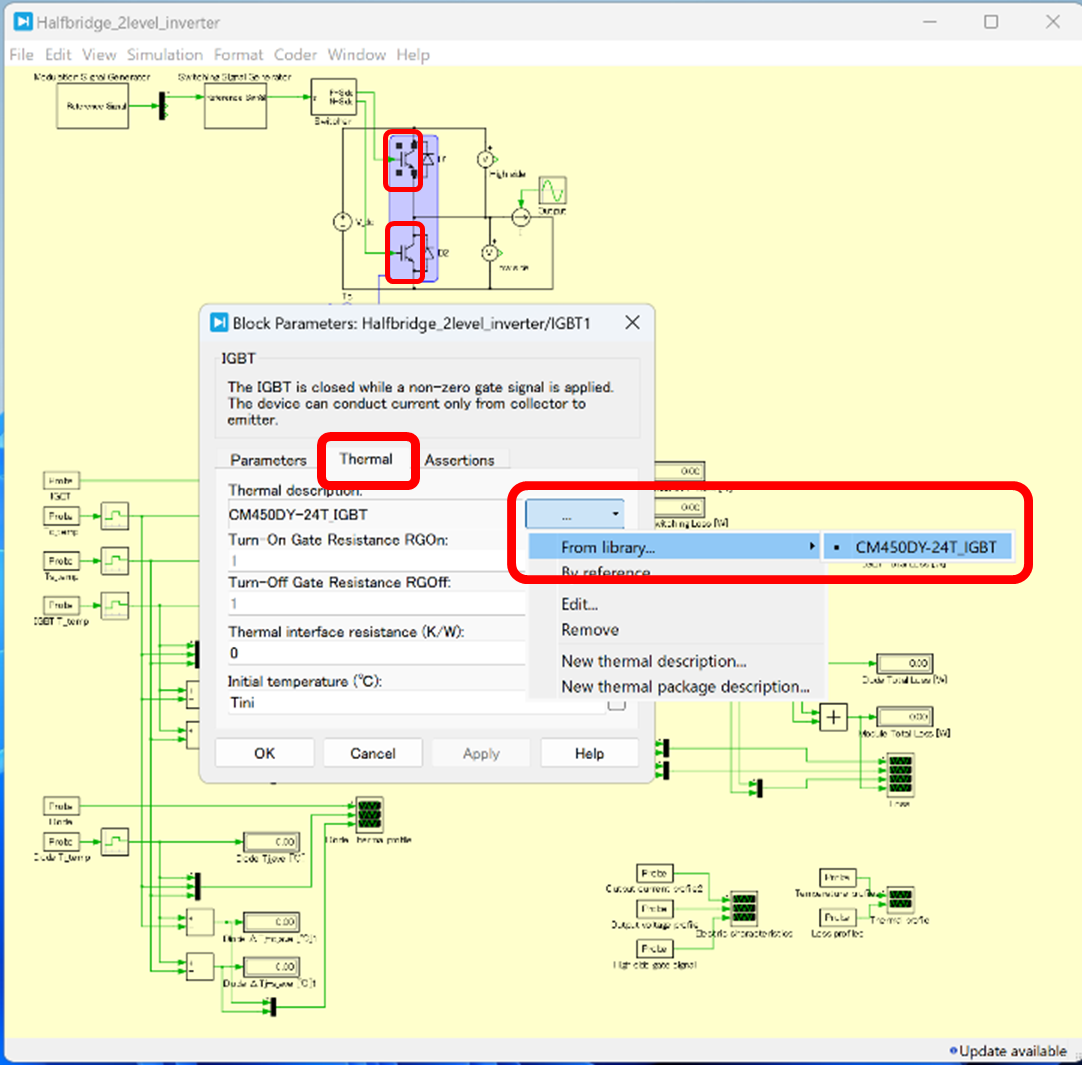
Figure 3-1. Selection of IGBT (Example)
(2) Selection of Diode Components
・To select the diode "CM450DY-24T_Diode" for the half-bridge calculation, double-click on the diode symbol
and select the target model name in the "Thermal Settings" under "Block Parameters."
Please refer to Figure 3-2.
・Additionally, for the half-bridge, select both the upper and lower diodes in the same manner.
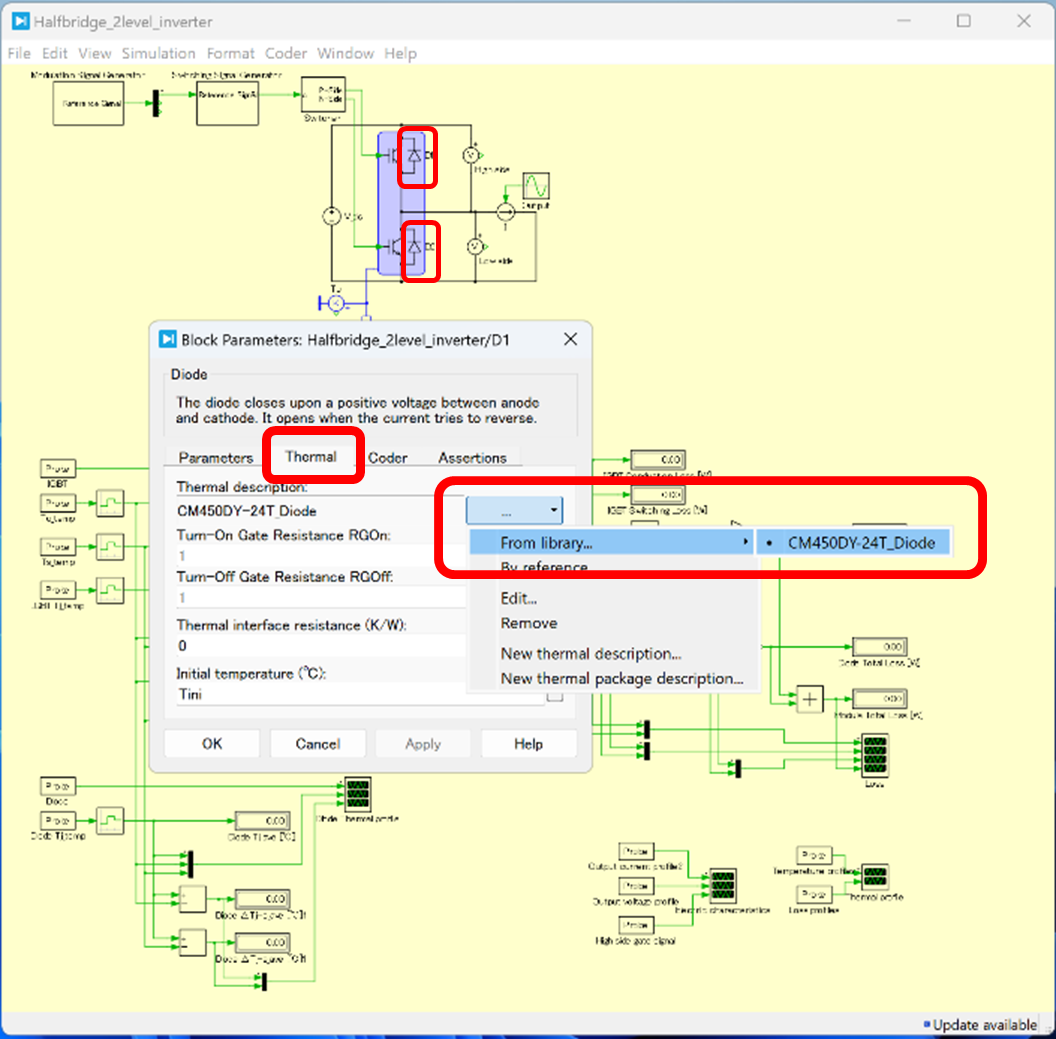
Figure 3-2. Selection of Diode (Example)
5. Setting Calculation Parameters
・As shown in Figure 4, go to "Simulation" → "Simulation Parameters" → "Initialization," and set the model initialization commands based on Table 2 below, then click "OK."
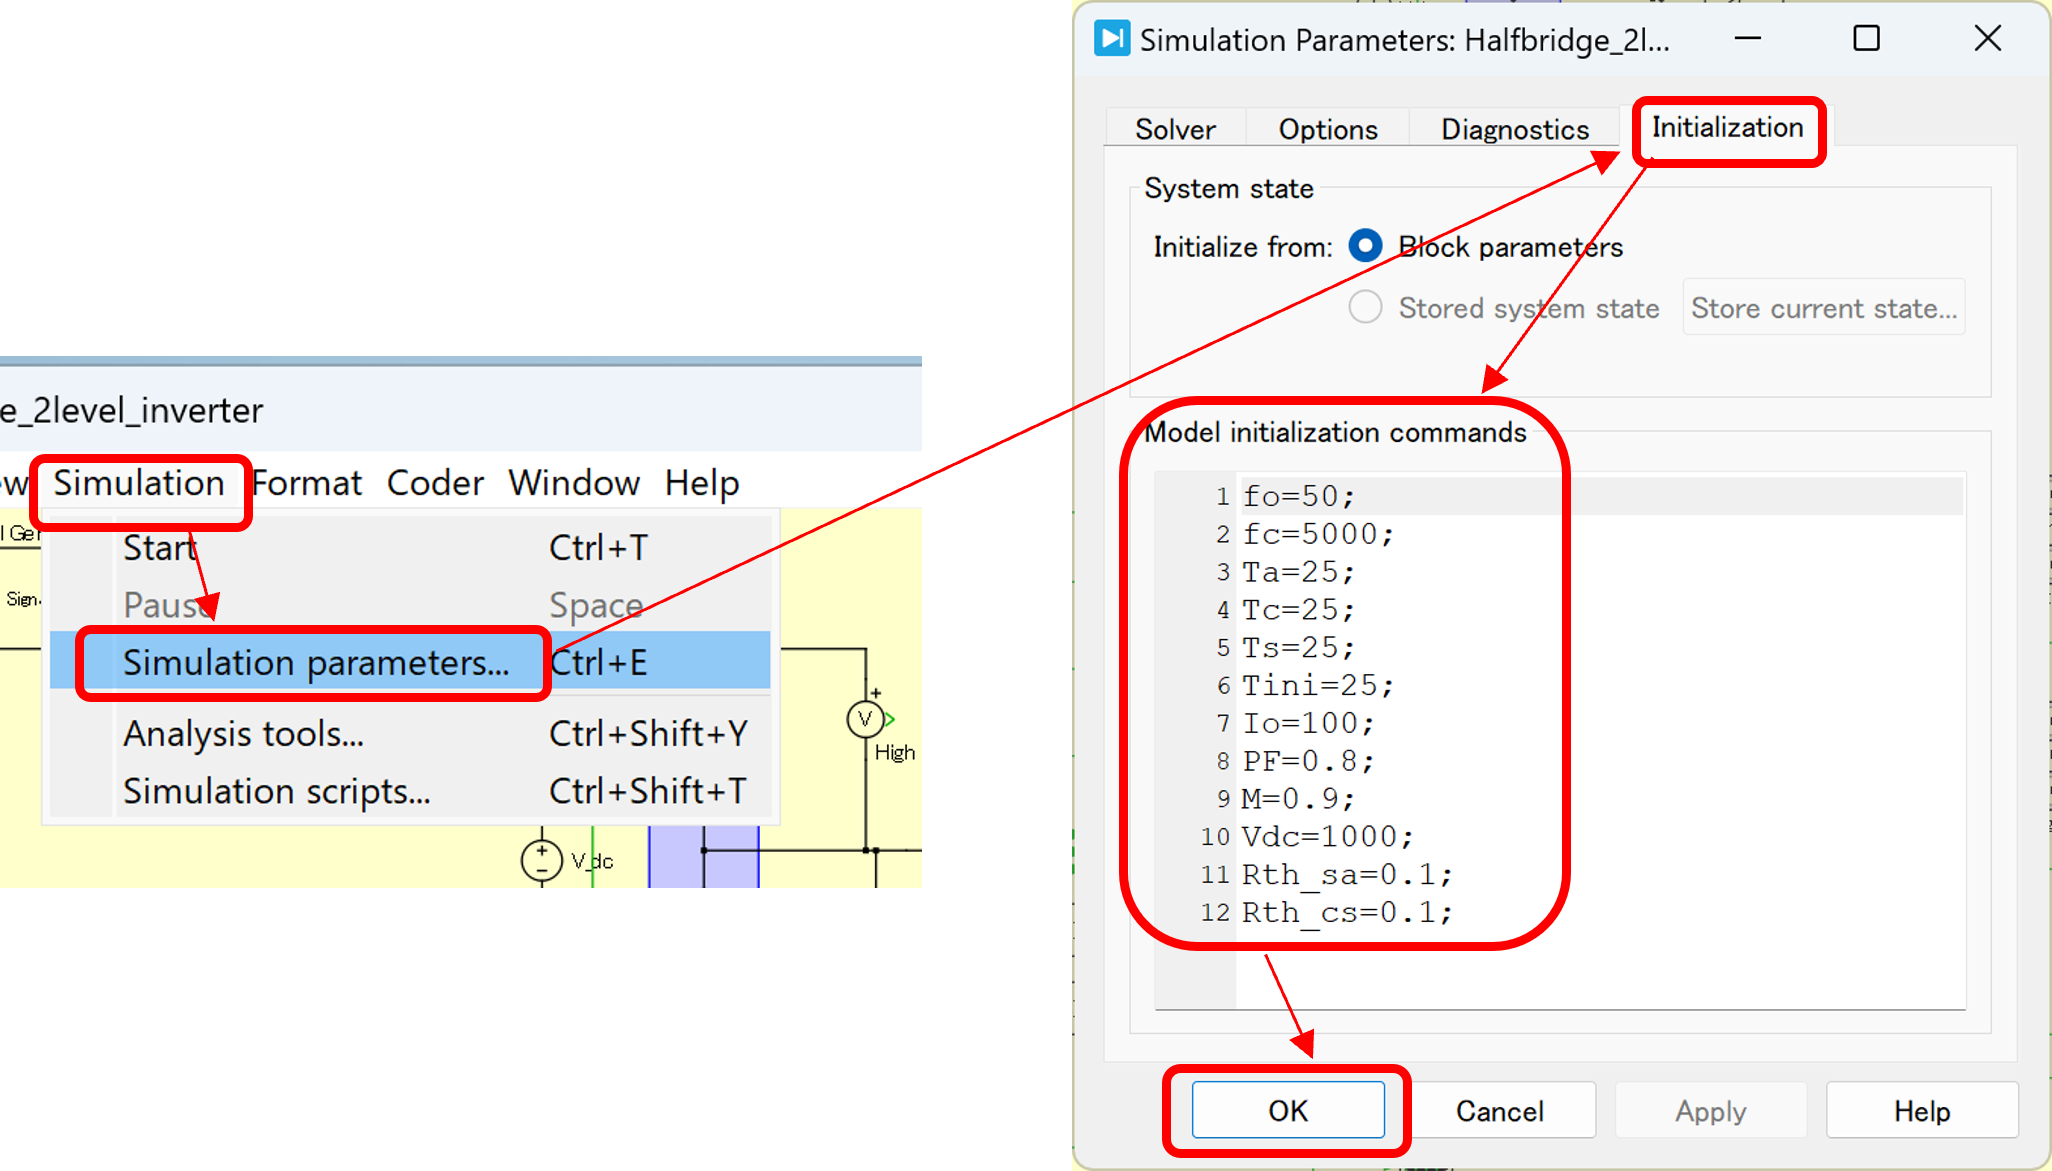
Figure 2. PLECS Settings (Example)
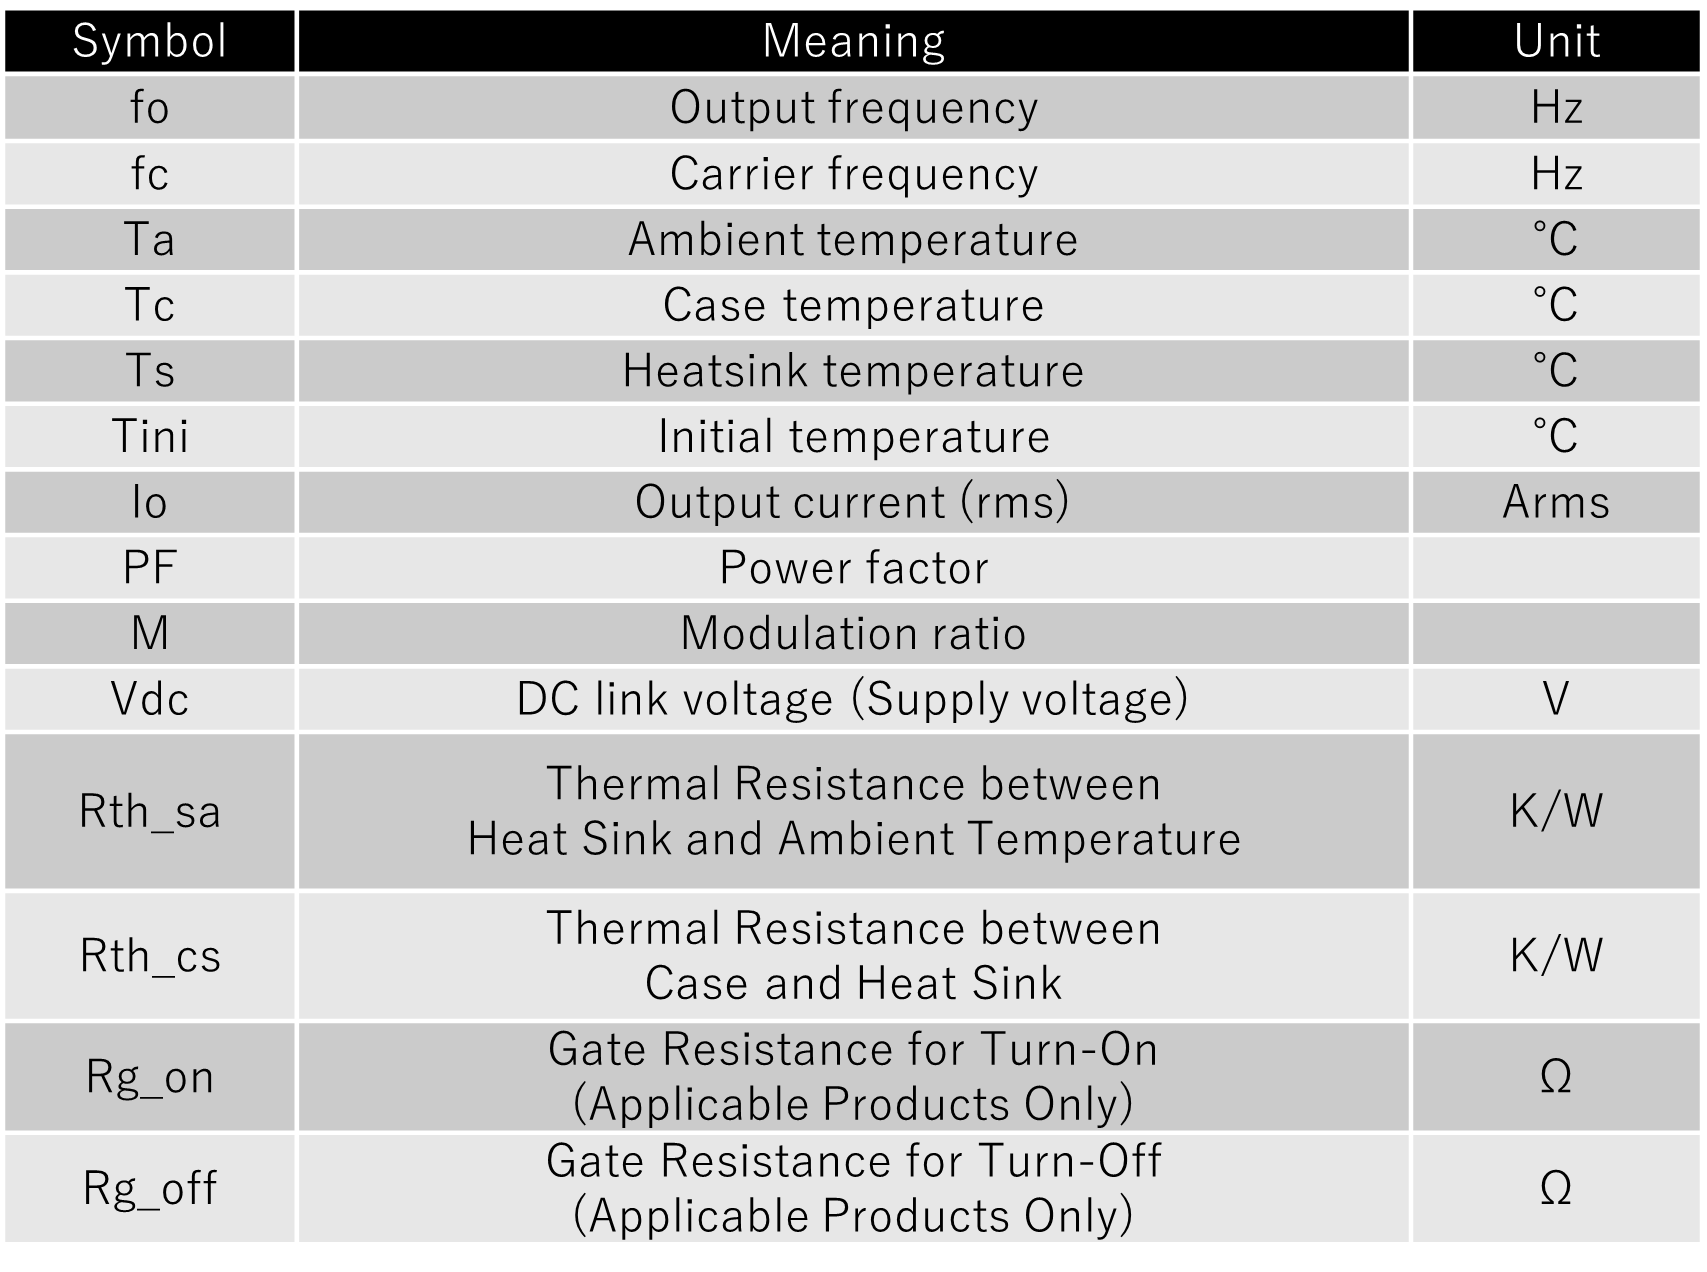
Table 2. Meaning of Model Initialization Commands (Example)
6. Execution of Calculation and Display of Results
・Click "Start" from "Simulation" to execute the simulation.
・The changes in the average junction temperature (Tj) of the IGBT and diode, case temperature (Tc), heat
sink temperature (Ts), temperature difference between junction and case (ΔTj-c), and temperature difference
between junction and heat sink (ΔTj-s) will be displayed, along with conduction losses, switching losses, and
the total losses of the module. Please refer to Figure 5.
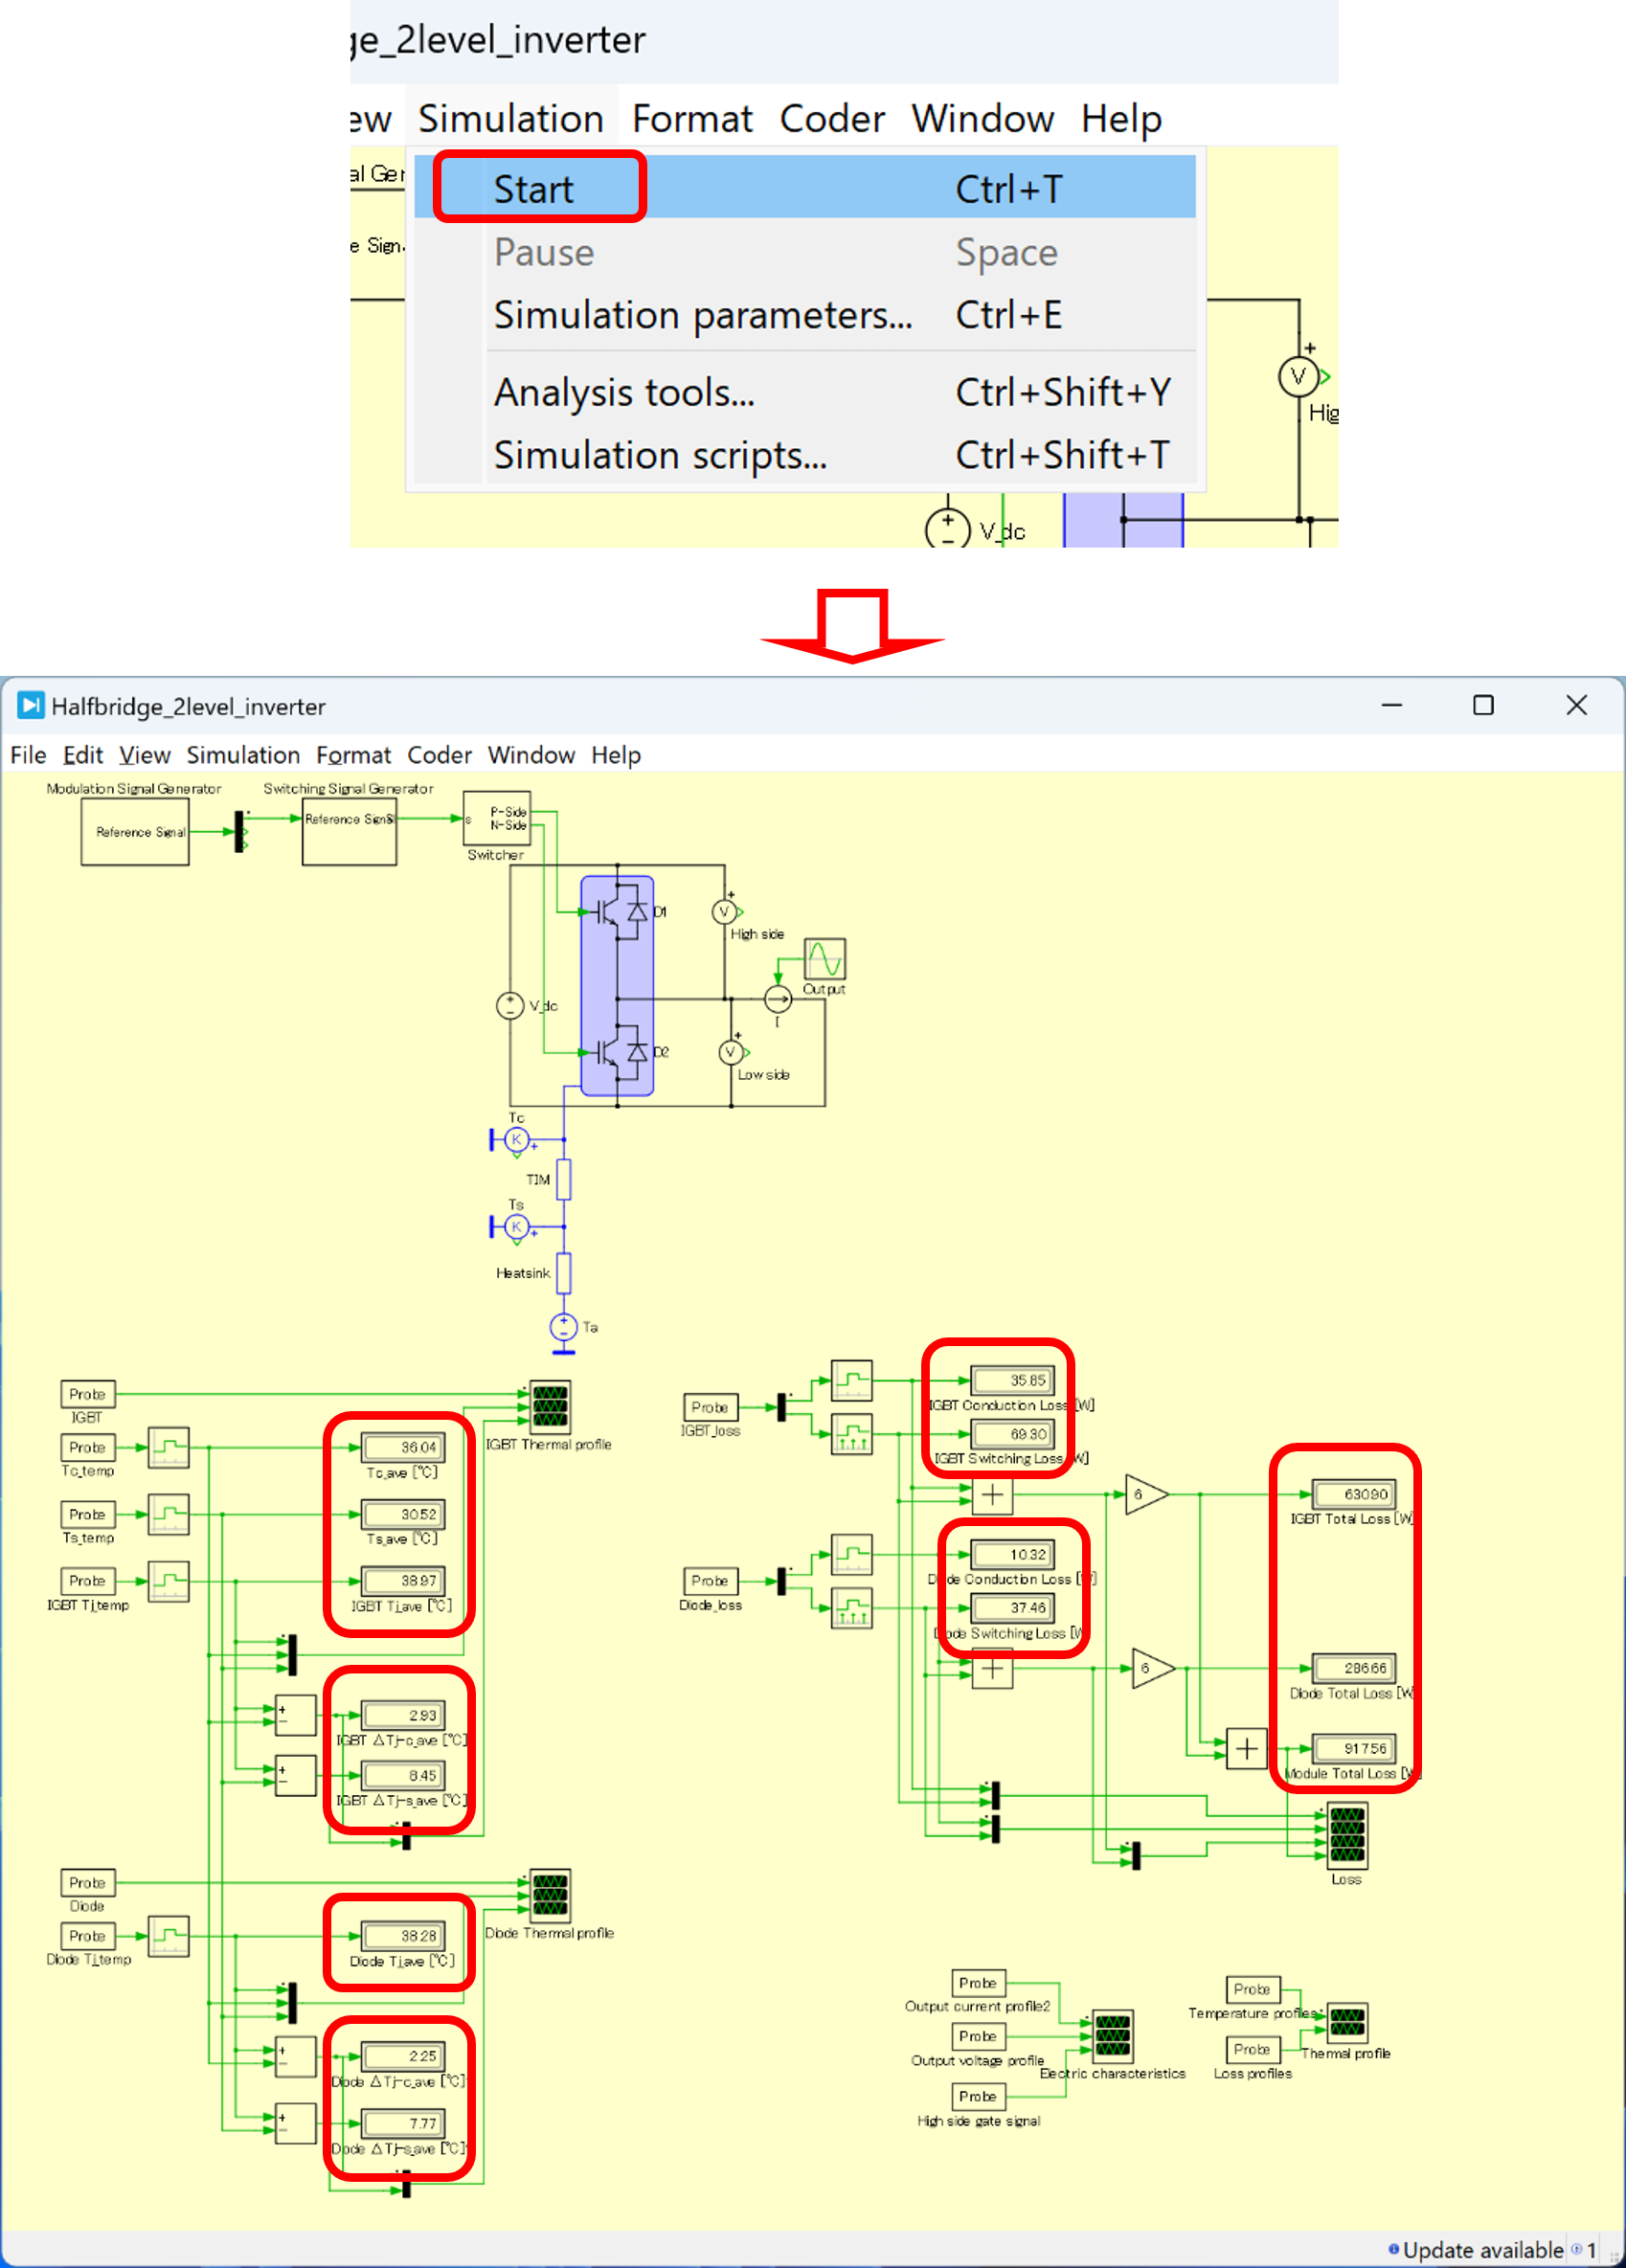
Figure 5. Simulation Execution Results
Supplementary Information
・The transient response of the temperature rise of the IGBT and diode, as well as the time variation of losses, can be illustrated as shown in Figure 6 below.
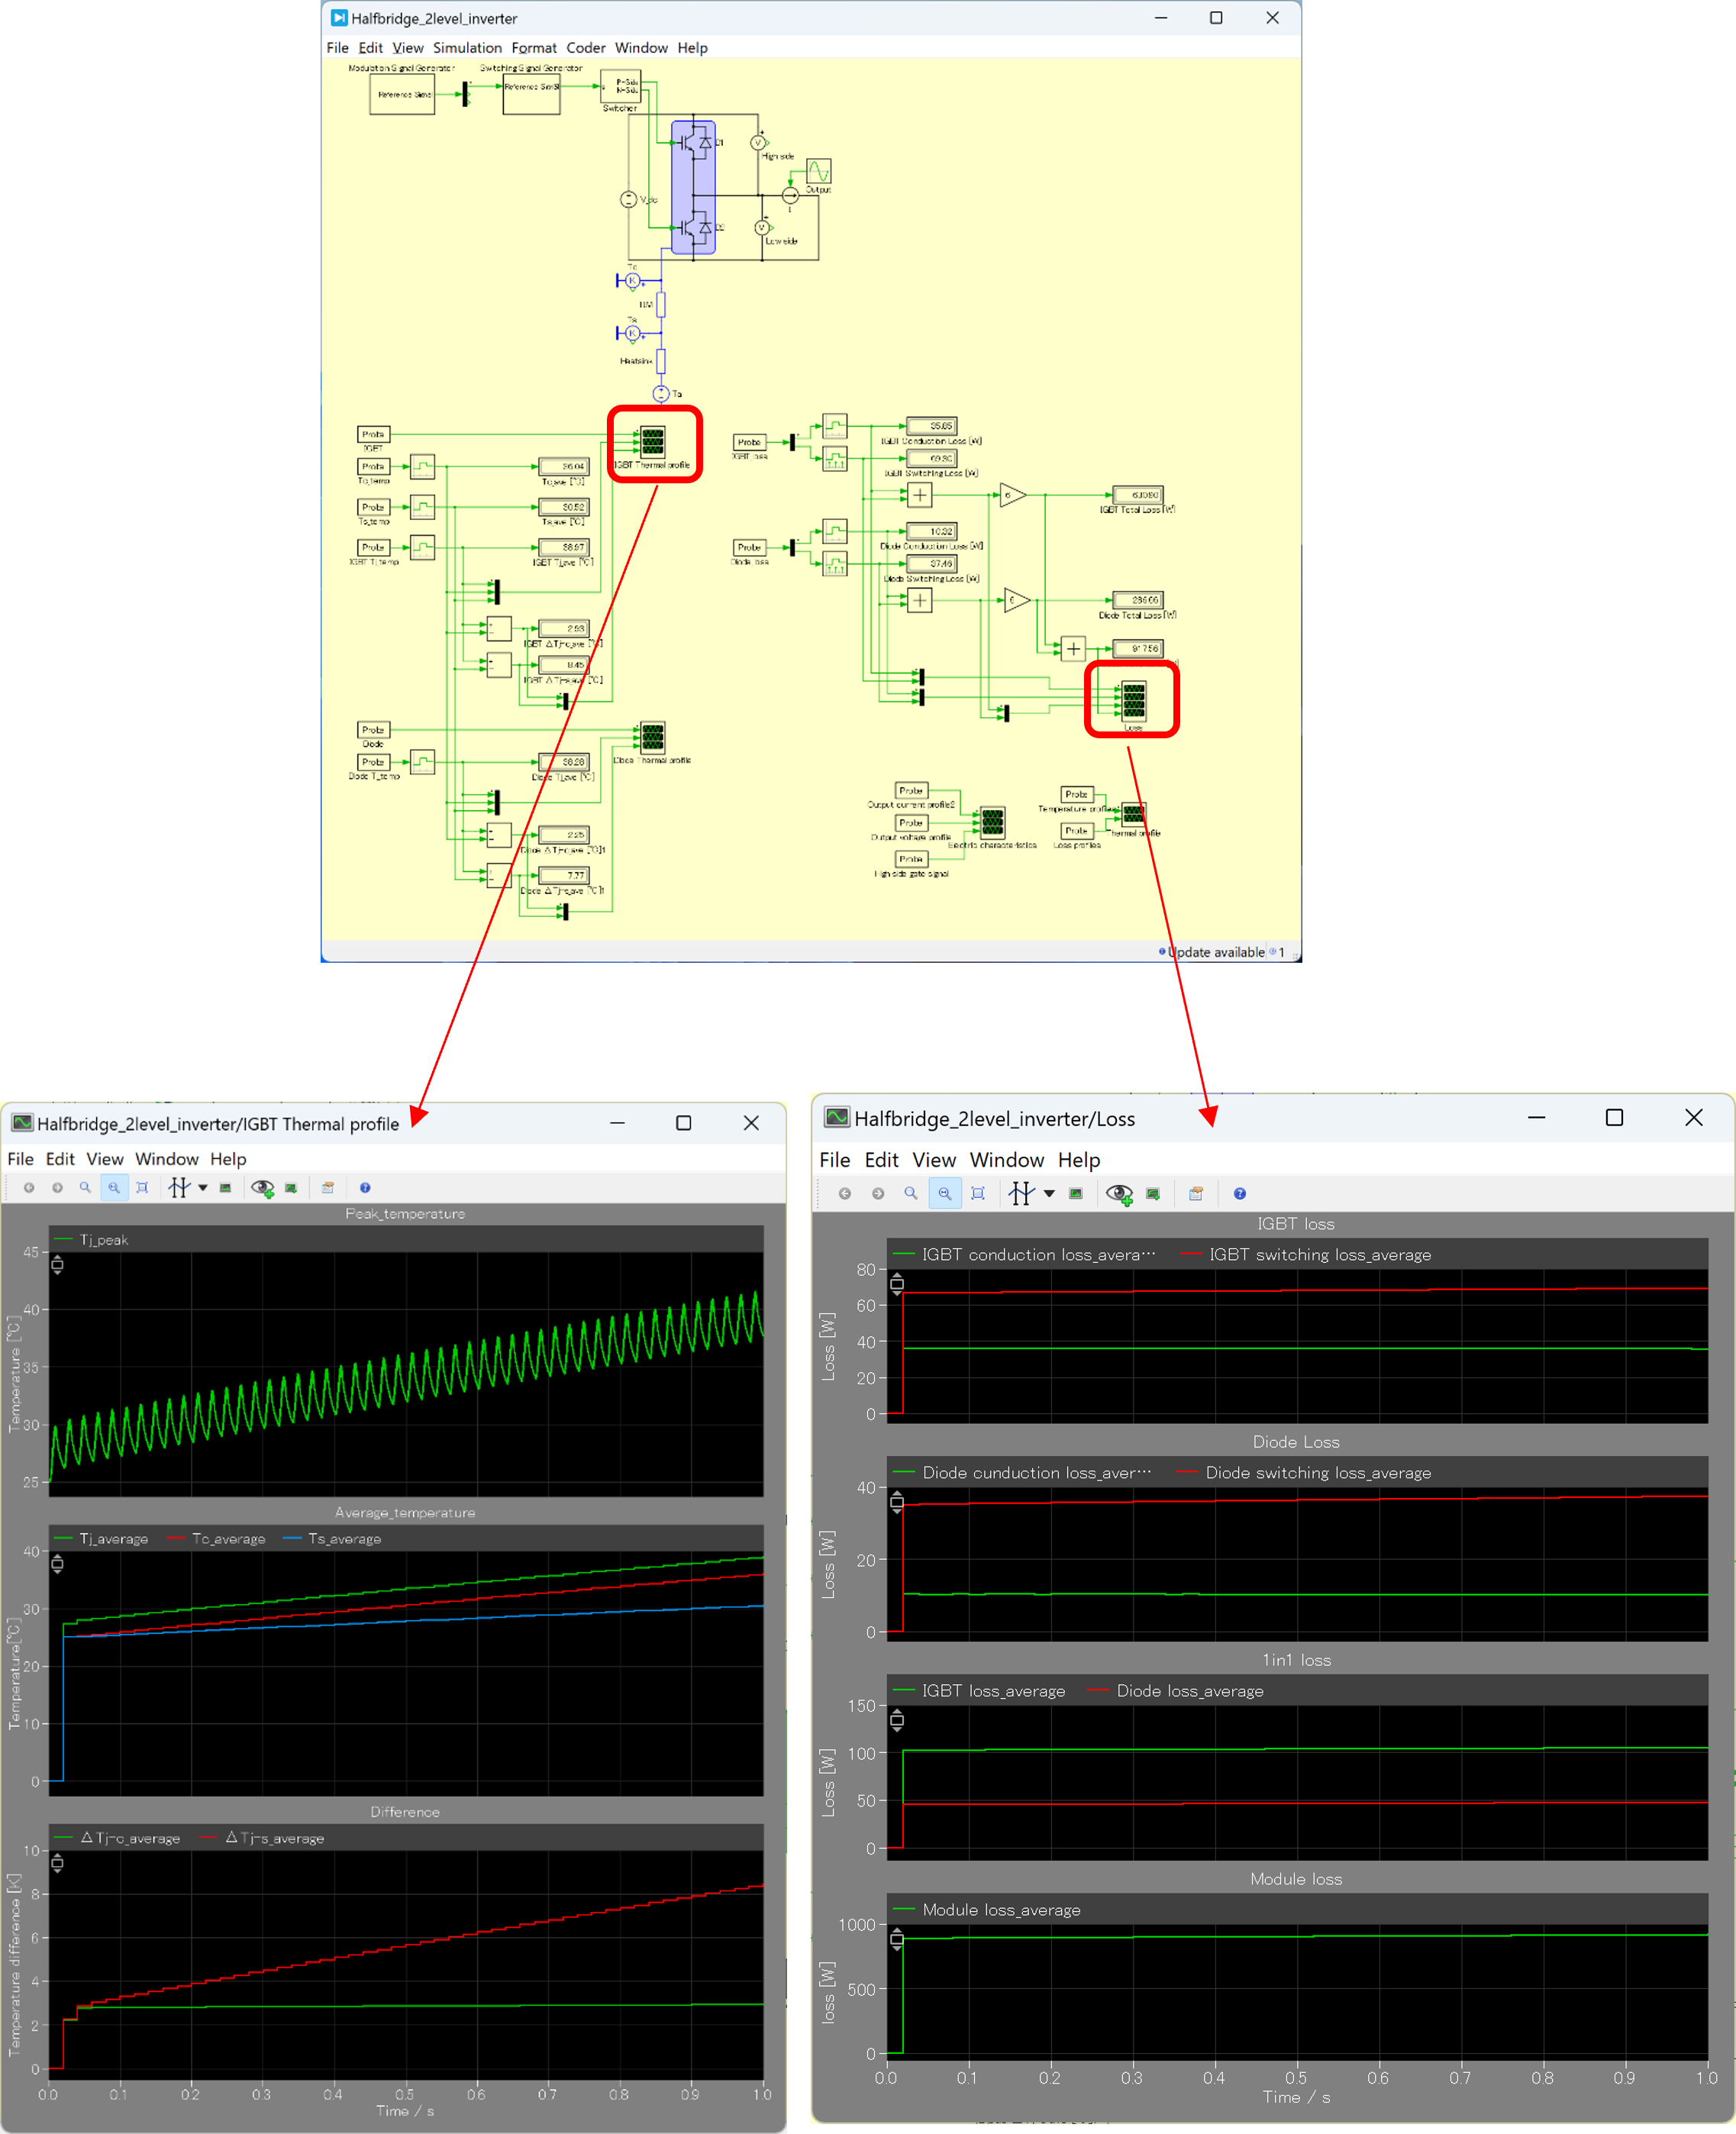
Figure 6. Simulation Execution Results (Example)
7. Method and Results of Steady-State Analysis
・Click "Analysis Tools" from "Simulation," select "Steady-State Analysis" from the "+" menu, enter the
information in "Basic Information," and then click "Start Analysis." Please refer to Figure 7.
・As shown in Figure 7-2, the results of the steady-state analysis can be output.
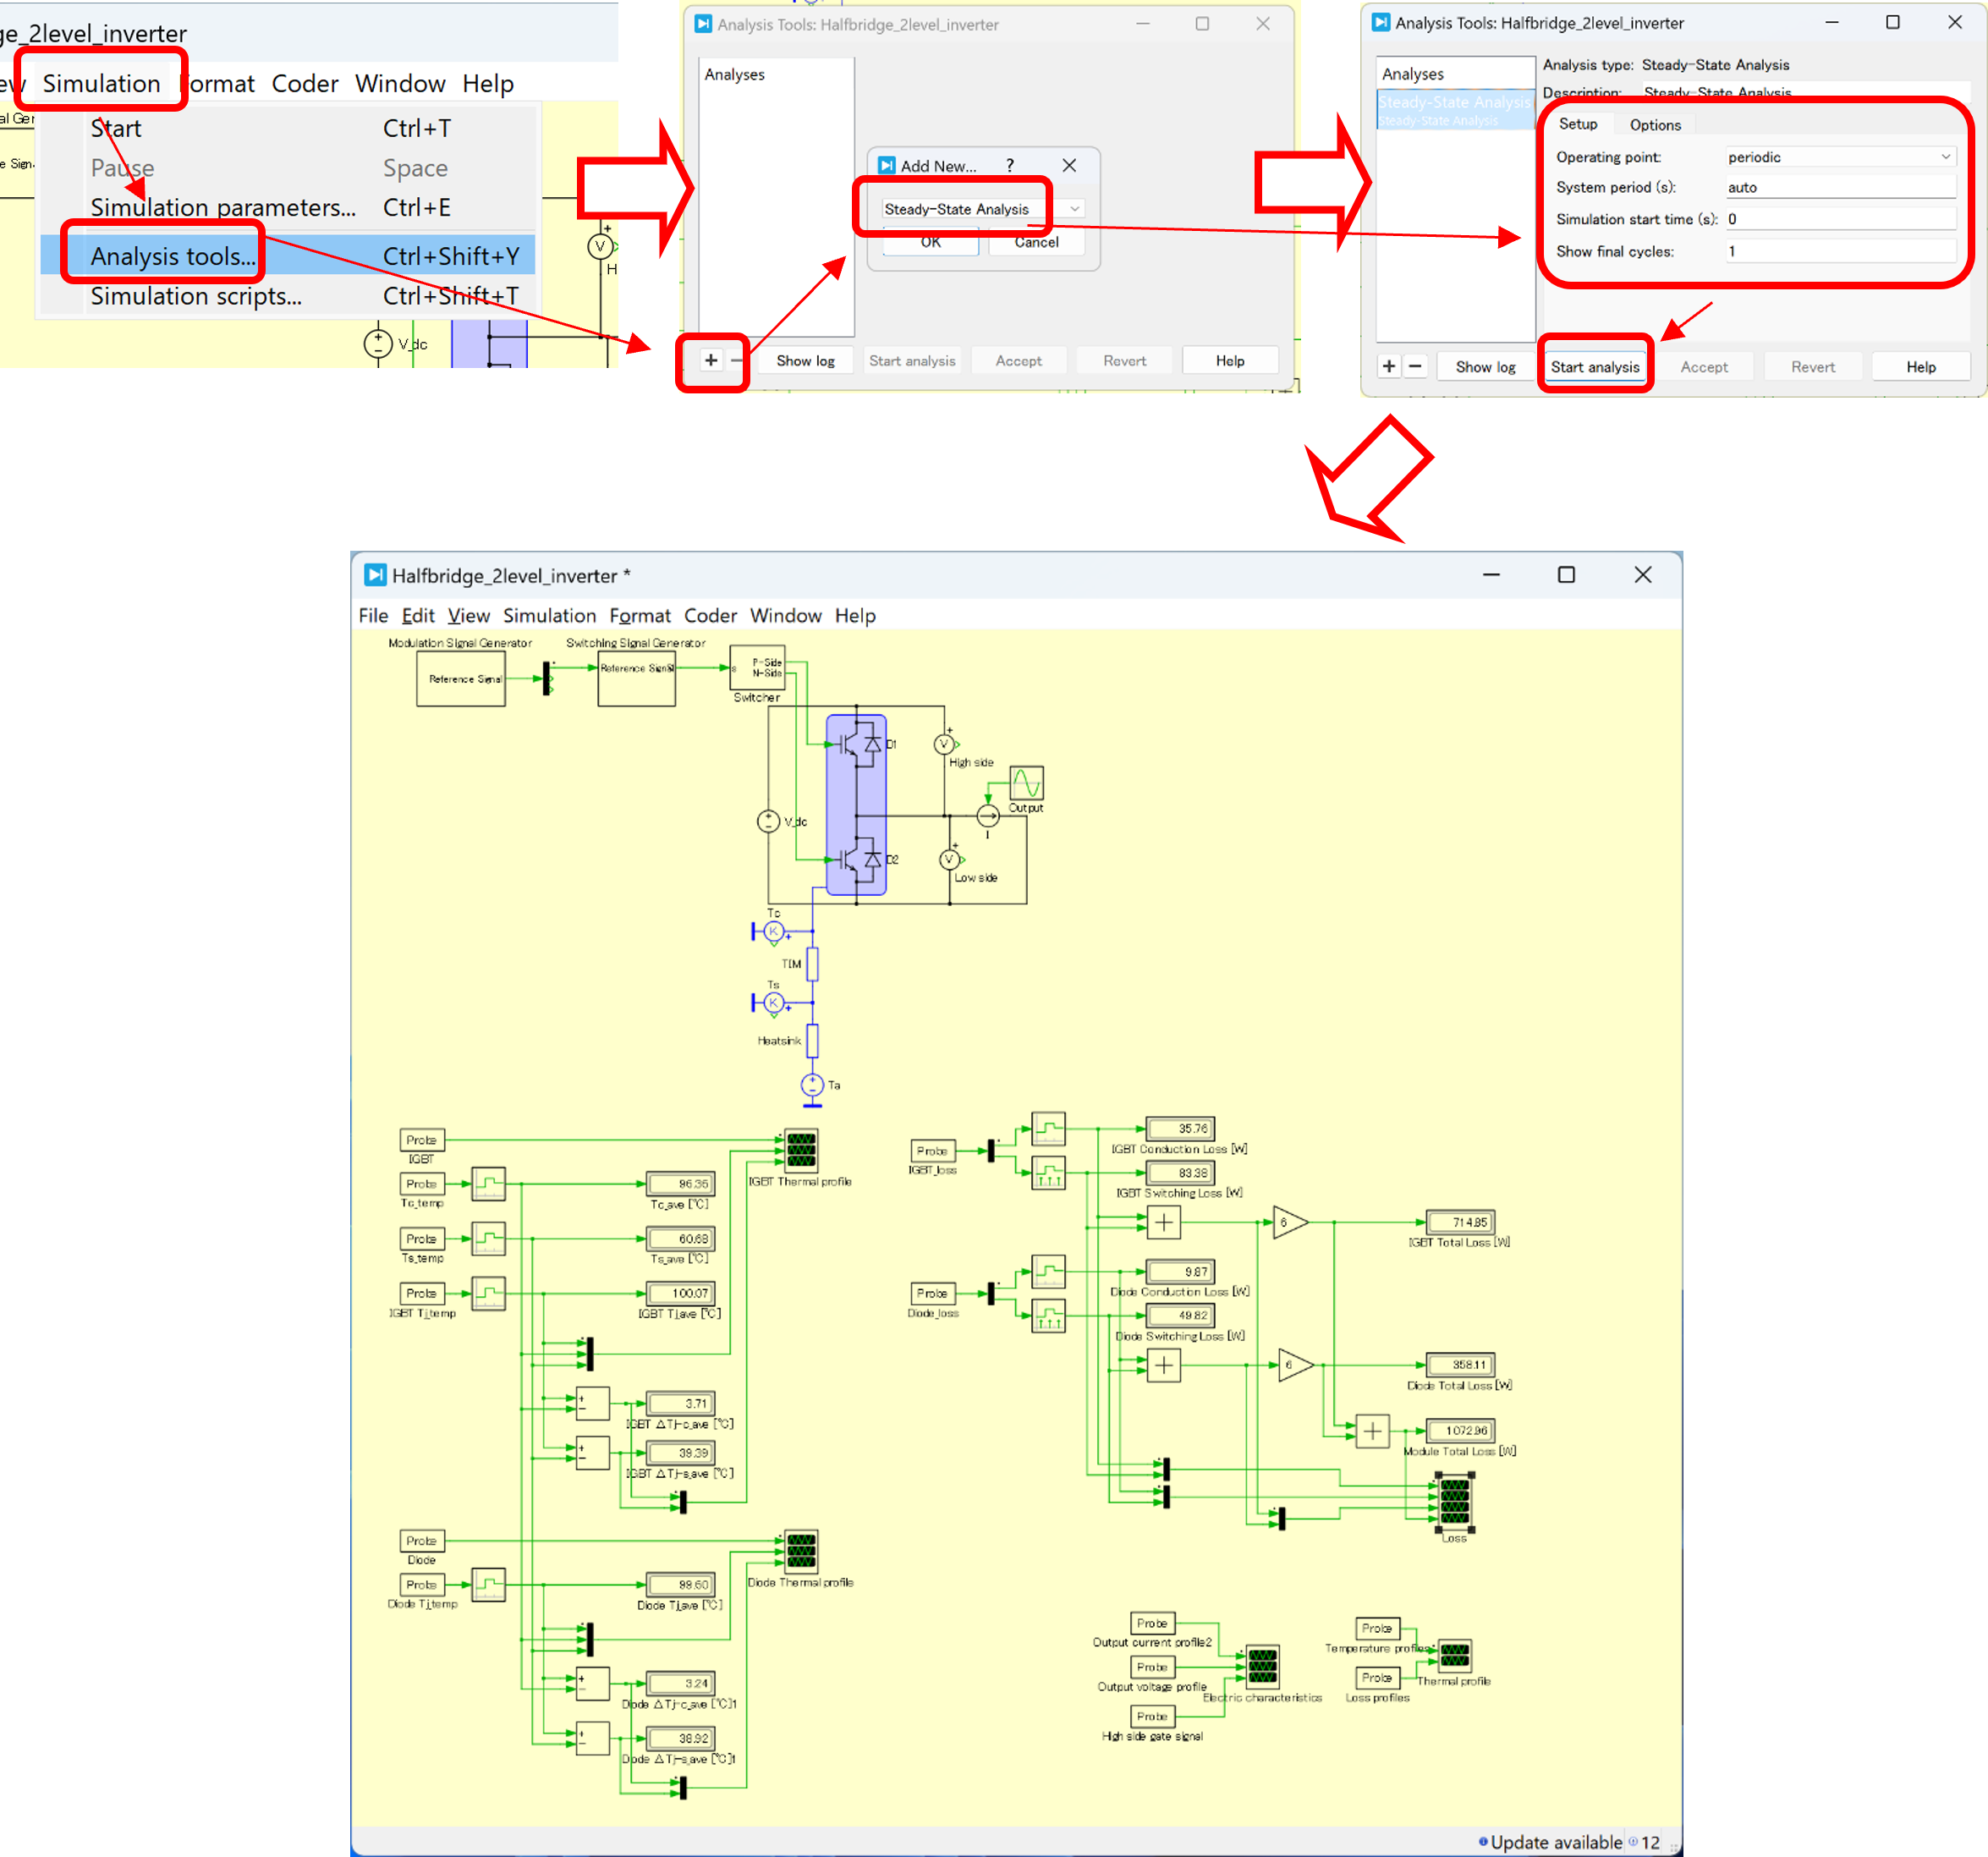
Figure 7. Simulation Execution Results in Steady-State Analysis (Example)