FA Application Package iQ Monozukuri ANDON
Easily create and customize screens!
Template screens of the ANDON system are included in the package
The screens frequently used at production sites are provided as templates, such as Production status screen, DANDORI* screen, and Uptime status screen. They can be used as screens to operate the on-site GOT (Web server) or as screens for ANDON display. Template screens are easily customized by using the screen design software for GOT (GT Works3).
- * DANDORI means replacing a production tool and machine or changing settings when switching products to be produced.
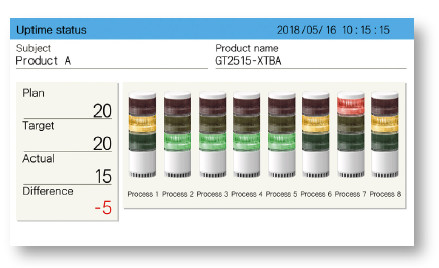
Uptime status screen NEW
This screen shows the uptime status of each production line by three-color indicator lamps. The colors of the lamps change according to the uptime status at the production site so that you can visually check the production status quickly.
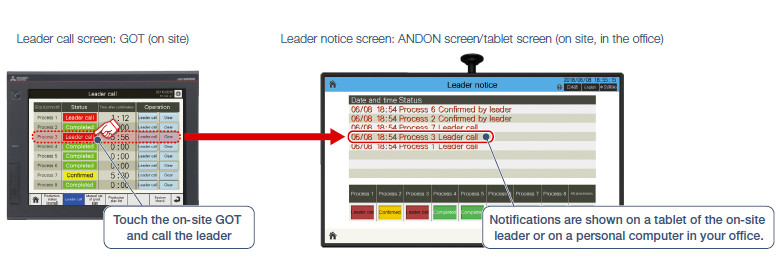
Leader call screen / Leader notice screen NEW
In this screen, you can call the leaders at the production site through the on-site GOT. The operators can call the leader/maintenance leaders without leaving the production site so that they can take corrective actions quickly and reduce downtime of the equipment.
Screens for use on on-site GOT (Web server)
Main screen
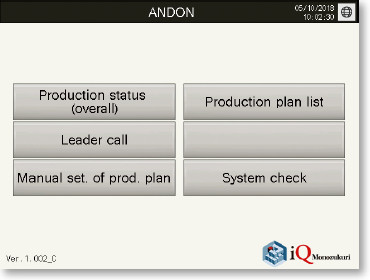
This screen is used to switch to each screen.
Production status (overall) screen
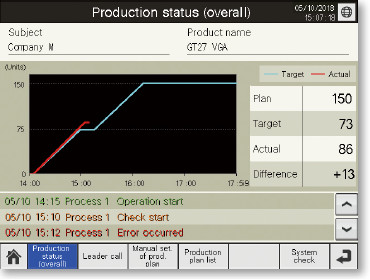
This screen is used to display the production results in numerical value and as a graph (progress chart). Also, events and alarm occurrence status are listed.
Leader call screen NEW
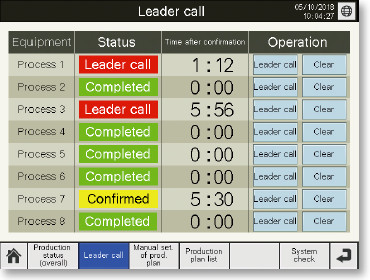
From the on-site GOT (Web server), you can call the leader for each process and confirm response conditions on this screen.
For the details, please see here.
Production plan manual settings screen NEW
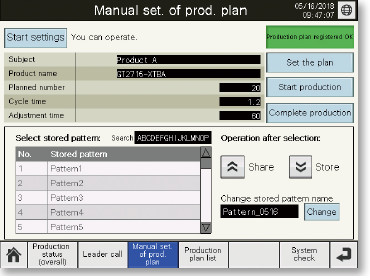
This screen is for setting the production plan from the GOT (Web server). You can enter the production plan for each product.
For the details, please see here.
Production plan list screen NEW
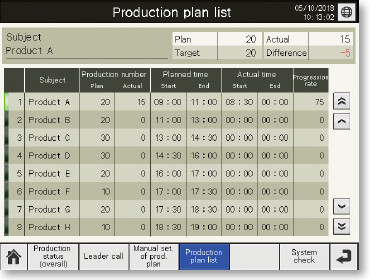
This screen will display the data acquired from Contents Publisher or ANDON DB as a list. Displays the details for production plan name, number of production, actual time and progression rate.
System check screen
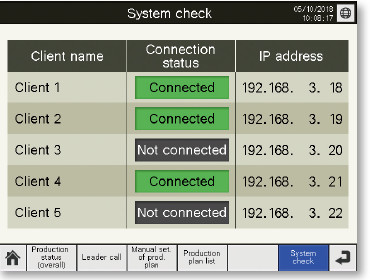
This screen is used to check the connection status between the GOT (Web server) and the client (display terminal).
Template screens for ANDON
Uptime status screen
This screen displays the production results of the production line in operation in numerical values, and also displays the status of various processes in different colors.
Uptime status screen NEW
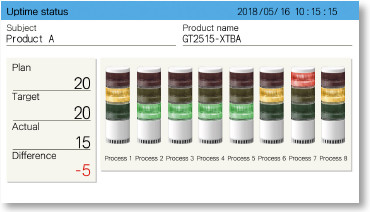
This screen is used to display the uptime status of the production line.Display each process status via the lamp.
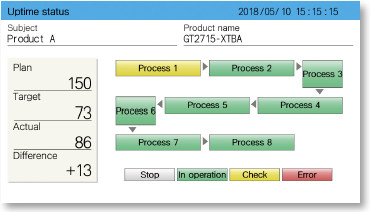
Production status (overall) screen
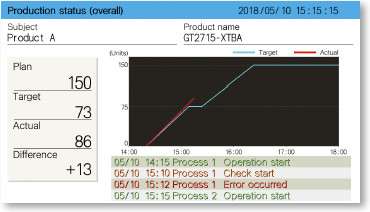
This screen displays the target quantity and production results graphically in a progress chart, which can be used to check progress and production delays. Events and alarm occurrence status can be checked on the same screen.
For the details, please see here.
Production status (progress) screen
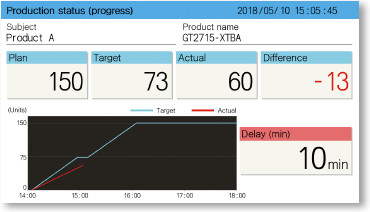
In addition to graphs in progress charts, this screen displays ahead of schedule time or delays in numerical values. Even though the site area is large, the numerical values are displayed large so that they can be seen from a distance.
Production status (simple) screen
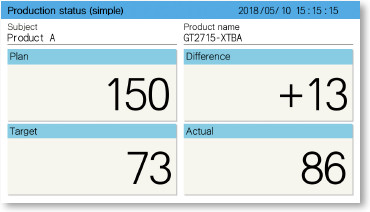
As with the general ANDON screen, this screen displays the production status in numerical values only. Numerical values are enlarged to enhance the visibility of the production status.
DANDORI screen
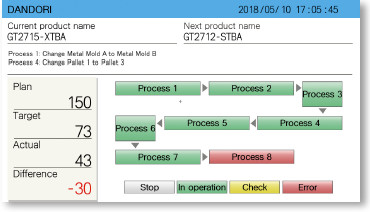
This screen displays messages necessary for DANDORI and the product names before and after DANDORI.
User alarm history screen
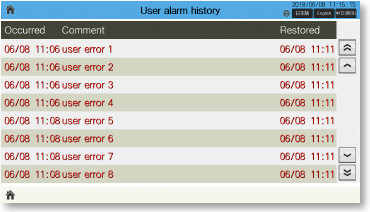
This screen is used to display the user alarm history on a client (display terminal). Displays the list of the alarms (such as errors of devices during operation) occurred in the production line.
ANDON alarm history screen
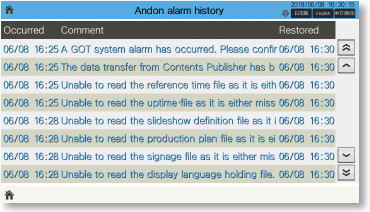
This screen is used to display the ANDON alarm history on a client (display terminal). Displays the list of the alarms occurred in the ANDON function.
System alarm history screen
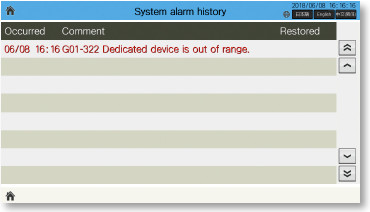
This screen is used to display the system alarm history on a client (display terminal) for the alarms occurred in the GOT (Web server). Displays the list of the system alarms that have occurred in the GOT (Web server).
Event history screen
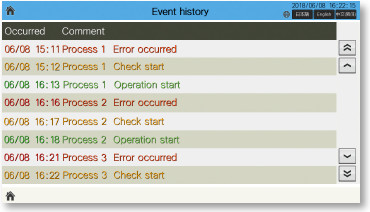
This screen displays a list of the events (such as start and stop operation of the equipment) that occurred in the production line.
Leader notice screen NEW
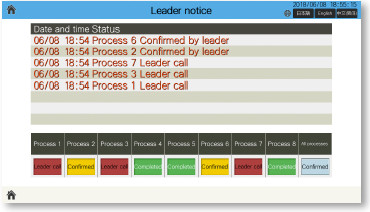
This screen is used to display the call status of the leader on a client (display terminal).
For the details, please see here.
Production plan manual settings screen NEW
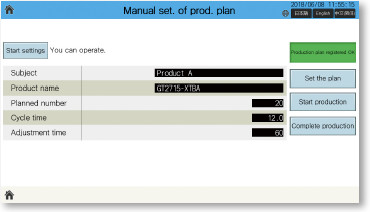
Operation screen to manually set the production plan from a client(tablet).
Daily production plan screen NEW
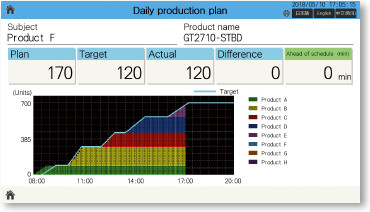
This screen displays multiple products' production plans and production results as numerical values and in a progress chart.
For the details, please see here.
Production plan list screen NEW
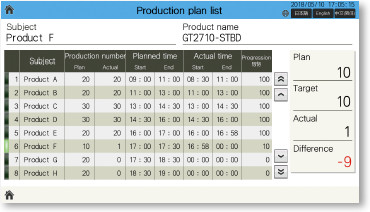
This screen displays the status of that day's production plan. Displays the details for production plan name, number of production, actual time and progression rate.
For the details, please see here.
Multiple line monitor screen NEW
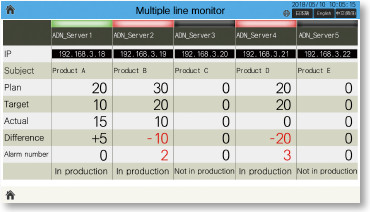
This screen displays the production status of the GOT (Web server) that is assigned to an IP address from ANDON DB (database).
For the details, please see here.
Remote control screen
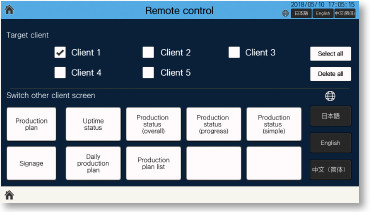
This screen is used to switch among other client screens (display terminals) by remote control. Select a client (display terminal) and switch a display screen or a display language.
For the details, please see here.
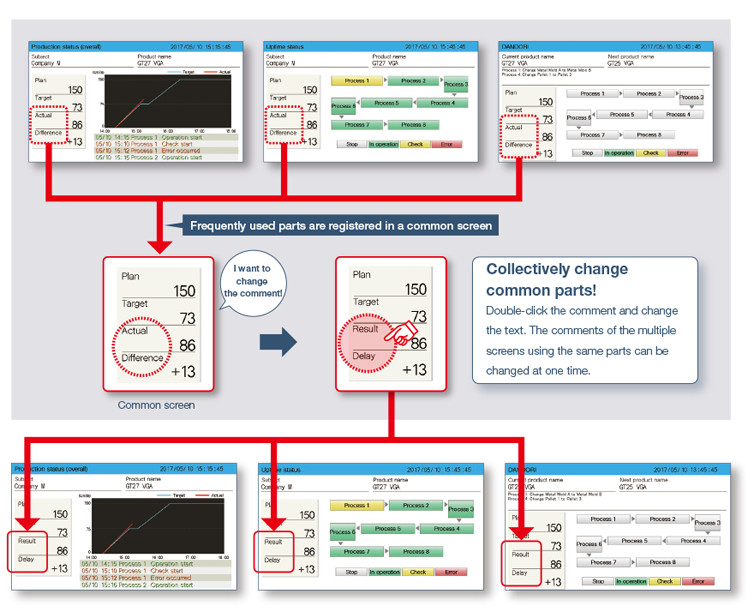
Easily change template screens collectively!
In template screens, parts used in multiple screens are registered as common parts so that the displayed information can be changed collectively.
Easy display setting of signage screens! (bulletin boards and others)
By displaying the visitor schedule, notifications, and equipment maintenance notifications on signage screens (bulletin board and others), information can be given timely. Displayed information is set using the Contents Publisher*
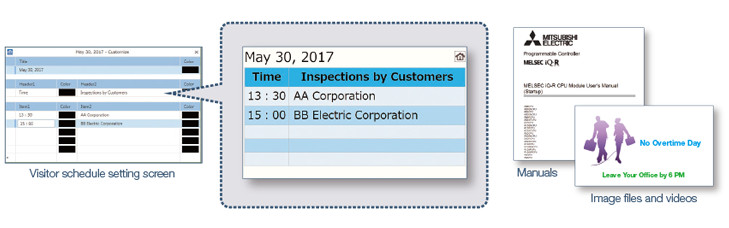
- * Contents Publisher is a tool to configure the ANDON system, which easily updates schedules and information on a bulletin board without technical knowledge of programming.