
Improving equipment utilization rates by visualizing production results
First released August 2015
The E4 Building at Mitsubishi Electric’s Nagoya Works uses the latest manufacturing systems with e-F@ctory technology to produce PLCs and HMIs. On the 6th floor, operations are highly automated, which requires a maximized equipment utilization rate. An e-F@ctory approach ensures this by quickly detecting issues, allowing maintenance to be carried out before any significant reduction in utilization.
Key points of this case study
- 1. Real-time visualization of planned and actual production quantities to quickly spot problems
- 2. Investigation of relevant data to analyze causes and take action when the utilization rate drops
- 3. Cooperation with the design department based on actual on-site data
Introduction to the Nagoya Works – E4 surface mounting line
The Nagoya Works E4 Building manufactures PLCs and HMIs. Surface mounting of electronic components is performed on the 6th floor, which involves installing more than a thousand parts on both sides of a circuit board. This process is automated for most components. A single production line performs a series of steps, including printing solder paste onto the board, picking out parts to be mounted as well as fitting them on the board, and heating with an electric furnace.
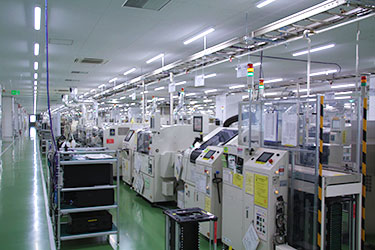
Automated mounting line on the 6th floor of the E4 Building
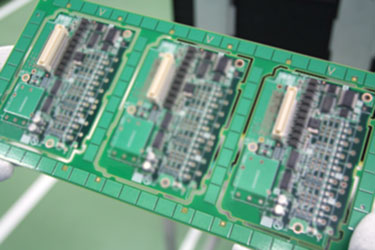
Various sizes of electronic components installed onto a board
To improve the utilization rate of an automated production line, it is necessary to minimize malfunctions and downtime to ensure that equipment operates effectively. In the surface mounting process, picking up parts and installing them onto the board is the step which requires particular attention.
Components to be installed on the board are supplied one at a time by a tape on a reel. The mounting equipment picks up the component from the tape via suction and fits it. Suction errors tend to occur during this process, which posed a problem when it came to improving the equipment utilization rate at E4.
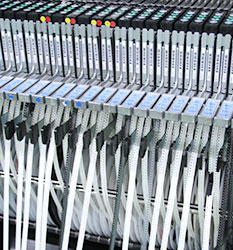
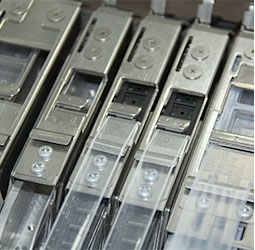
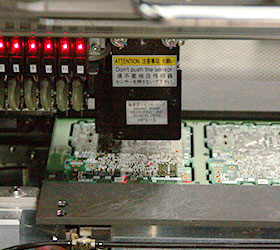
Components to be fitted are supplied on a reel. The equipment picks up the component from the tape by suction and fits it onto the board
There are two main types of errors when mounting: failure to pick up the component and sucking up the part at the wrong angle. Failure to lift components may be caused by contamination or damage to the tip of the suction nozzle, or, incorrect feeding of the reel that supplies the components.
Picking up parts at the wrong angle can occur when the nozzle targets an unintended area. The equipment uses a camera to recognize the component and automatically corrects the angle when mounting it onto the board. However, only a limited amount of correction can be performed. In some cases, such as when the side of the component has been picked up, it is impossible. This results in a component being ejected before it is mounted onto the board, which slows down production and reduces the utilization rate.
To improve the equipment utilization rate, issues like this need to be detected as soon as possible and resolved before they impact the entire process. Using e-F@ctory technologies to collect and visualize data allows operators to quickly identify error information such as pick-up failures.
Problem detection and cause analysis based on changes in production
Reduced utilization rates caused by issues like pick-up errors first manifest themselves as changes in production volume. By collecting actual production volume data from the equipment and comparing it to the planned output, any discrepancies can be identified. Data is collected in real time, and the status of multiple lines can be viewed on a single screen.
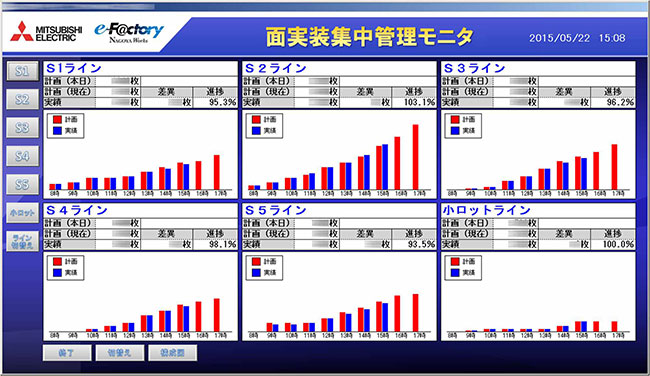
Real-time centralized management of operation status comparing planned and actual results
Displayed data is updated in real time, so any discrepancy between planned and actual output will be spotted as soon as it begins to appear. If the discrepancy gradually increases, it indicates that there is an equipment issue. Related data can be used to analyze the cause and start taking action to rectify the problem.
For example, if the pressure of the suction nozzle has dropped, it might indicate an air leak. A possible solution could be replacing the nozzle. If components are being picked up but not mounted onto the board, this indicates that the angle of parts has not been corrected, so it will be necessary to adjust the suction device angle or position. Rather than simply showing error information, the system enables the operator to pinpoint the cause from relevant data, highlighting what improvement measures should be taken.
Quickly spot any changes on site
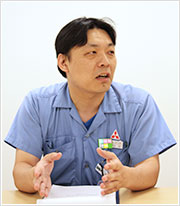
“We could already find out whether parts were being picked up correctly from the suction rate data. But that data was stored in the equipment, so the operator could not see it without actually going to the equipment. Now, data for multiple lines are automatically displayed on the administrator's terminal via the network, so any changes can be spotted at once,” says Kondo, Head of Assembly Team 2, PC Manufacturing Division, FA Manufacturing Section.
Increasing the equipment utilization rate requires data, first to identify issues and then verify the effectiveness of improvements. But if the collection cycle depends on how often operators actually go and look at the equipment, improvements cannot be made quickly, so e-F@ctory allows on-site data to be tracked in real time. “This reduces the time required to collect and analyze the data and consider what action should be taken, speeding up the Plan-Do-Check-Act (PDCA) cycle,” says Kanbara from Production Engineering Team 1, Production System Promotion Department.
Kondo, Assembly Team 2, PC Manufacturing Division, Factory Automation (FA) Manufacturing Section
Collecting data using e-F@ctory technologies is also an effective way to accurately schedule maintenance. In the pick-up process, it was determined that servicing should be carried out after a certain number of errors picking up the same component. But the operator could only find this data by actively going to the equipment in question to get it. With the e-F@ctory on-site system, as well as displaying the cumulative number of errors on the screen in real time, it alerts the operator when it reaches the total where servicing is required. This ensures that necessary maintenance is never missed.
Data showing equipment status is also shared with all workers at the morning meeting, not just the operator looking at the screen. By distributing information about what signs have appeared in which step of the process, all workers can share their knowledge, facilitating continuous improvement.
Kanbara, Production Engineering Team 1, Production System Promotion Department
As a result of many years of enhancements, the surface mounting process had already achieved a high utilization rate. Considering this, it is very difficult to unlock further increases. However, by harnessing e-F@ctory technology to visualize changes using real-time on-site data, the facility is intensifying its efforts to achieve a 100% equipment utilization rate.
Getting to the root of issues by revising designs
The suction process data gathered by the e-F@ctory setup is not only used to enhance equipment on the line - it is also used to improve the design of the components. Although problems picking up parts should initially be addressed at the line, there may be cases where this still cannot solve the problem. In such an eventuality, the design of the component is revised based on data from the e-F@ctory system.
“For example, if the surface of a component is finely textured, suction may not be stable. If this parameter appears to be unstable at the prototype or mass production trial stage, we may ask the design department for a change so that there is flat surface,” explains Kondo. This means that, rather than problems being addressed by the production site alone, there is a process to solve manufacturing issues with the cooperation of the design department.
“When asking the design department for help, in the past all we could say was: ‘This component can’t be picked up. Please do something!’ But with the e-F@ctory solution, we can show the actual data relating to the pick-up failure, lending more weight to our requests for design changes,” says Mizutani, Team Leader of Assembly Team 2, PC Manufacturing Division, FA Manufacturing Section.
Mizutani, Team Leader, Assembly Team 2, PC Manufacturing Division, FA Manufacturing Section
Issues that could reduce productivity or quality need to be addressed by the entire company, not just by the production site. In addition to problem-solving based on clear data, the e-F@ctory solution helps to create an environment where different departments can work together toward the common goal of improving manufacturing.
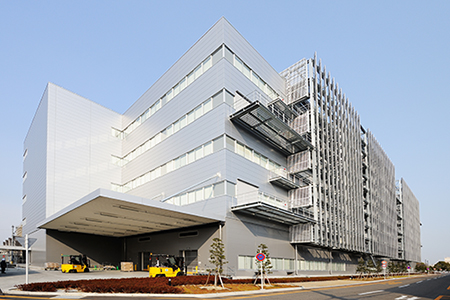
The latest E4 production site harnessing e-F@ctory technologies