Solutions
Data Collection/Analysis

The Cycle for shop floor Improvement With Data Utilization
Improving productivity, quality, and energy efficiency by utilizing shop floor data to find the key to solving production issues and promoting improvements
Case12Eliminating the performance gap between experts and inexperienced workers
analysis
Diagnosis
Issues


Solution
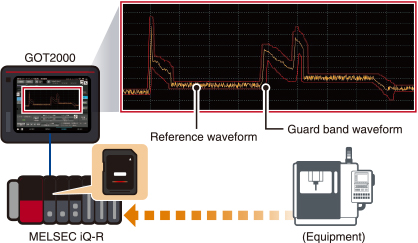
Use AI to compensate for the performance gap between experts and inexperienced workers.
MELSOFT MaiLab can recreate the years of experience and expertise of experts