Solutions
As the world faces increasing uncertainties and social changes, manufacturing companies understand the need to transform.
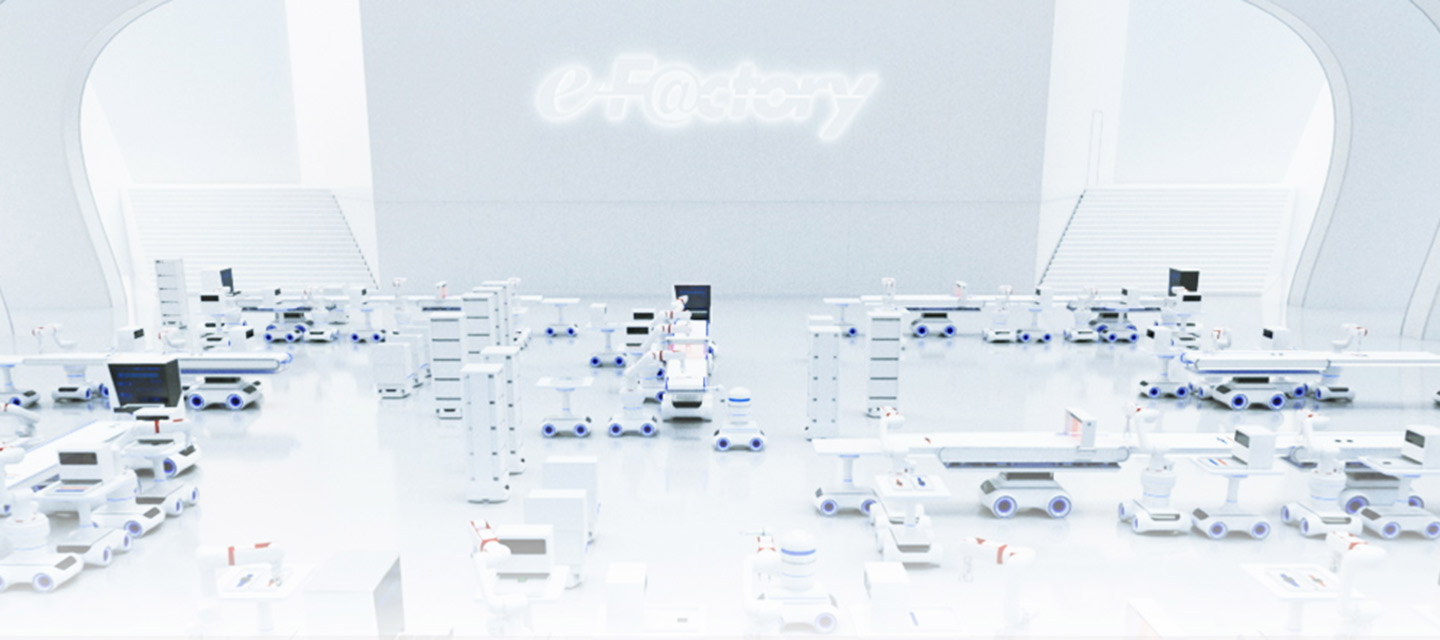
Mitsubishi Electric utilizes digital technology to connect the entire manufacturing life cycle with the aim of optimal and flexible manufacturing to address uncertainty.
Industries


Competencies


Our Stories
IoT-based Solution Examples
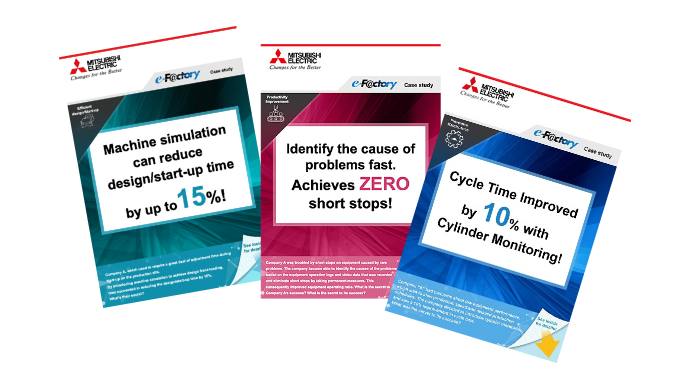
Introduction of actual examples where e-F@ctory solutions are applied to resolve customers' problems and the results thereof.
Solution Guidebook -Convenient usage of FA products-

Introduce how to use FA products to solve various business problems.
e-F@ctory Alliance
As a solutions provider, we collaborate with many partners across all monozukuri fields. This ecosystem provides optimal solutions in various regions and fields in response to the issues experienced by our customers.
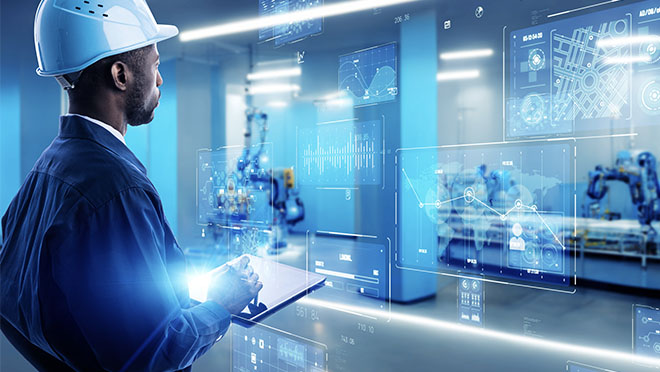
Digital Manufacturing
It does not matter if you call it Industry 4.0 or IIoT, the trend towards Digital Manufacturing is fundamentally changing the world of production. Mitsubishi Electric has been consistently supporting users to plot their way forward with tools like SMKL, yet remaining focused on the goal of achieving sustainable change and real ROI through its e-F@ctory concept.
Open innovation

Let's create new value together through "Open innovation" that organically integrates management resources.